

Biometric performance metrics are the error and success rates that describe how often a system wrongly accepts an impostor, wrongly rejects a genuine user, or fails to capture a usable sample at all. The vendor’s headline accuracy figure is rarely enough to judge a system. You need to know which error rates were measured, at what decision threshold, on which population, and whether the test resembled your production traffic. This guide defines each metric, shows how they relate, and explains how to read them when the decision affects fraud losses and customer friction.
TL;DR
- Biometric metrics are empirical estimates of error frequency: false accepts, false rejects, and failures to enroll or acquire, each counted against total attempts.
- FMR and FNMR describe the matching algorithm. FAR and FRR describe the whole system, including capture failures. Mixing them up makes vendor claims look better than they are.
- No single number describes accuracy. Every operating point trades false accepts against false rejects, so ask for the full ROC or DET curve and the threshold you will run.
- Laboratory results do not transfer cleanly to production. Ask for scenario and operational evidence, confidence intervals, and tests on data the system never saw.
Table of Contents
- What biometric performance metrics actually measure
- The error rates you will see in vendor documents
- Thresholds, ROC curves and DET curves
- Lab accuracy versus production performance
- What shifts performance: quality, population, modality and attacks
- What testing evidence to ask a vendor for
- A worked example of reading the numbers
- Our perspective
- Going further with Fraud Signals News
- FAQ
- Sources
What biometric performance metrics actually measure
A biometric metric is not a measurement of deviation from a known true value, the way a scale’s reading is. NIST describes biometric performance figures as empirical estimates of probability: the frequency of errors or successful events in the recognition process, relative to the total number of attempts. That distinction matters because an estimate carries uncertainty. A reported false accept rate of 0.1% from 500 impostor attempts is a very different claim from the same figure drawn from 5 million.
The same NIST paper lists the core measurands beyond match errors: failure-to-enroll (FTE), failure-to-acquire (FTA), and throughput rates. These are often the ones that decide whether a deployment succeeds. A matcher with excellent error rates is of little use if a meaningful share of users cannot be enrolled or the capture step is slow enough that customers abandon onboarding.
There is also a structural reason to distrust one-number summaries. NIST’s IREX 10 documentation notes that biometric decision-making is analogous to binary classification, so no single value can comprehensively describe a system’s accuracy. Any vendor who quotes “99.9% accurate” without naming the error type and threshold has told you almost nothing.
The error rates you will see in vendor documents
The vocabulary is where most confusion begins. The terms look interchangeable and are not.
- False match rate (FMR): the proportion of impostor comparisons that the algorithm scores as a match. It is a property of the matcher.
- False non-match rate (FNMR): the proportion of genuine comparisons that the algorithm scores as a non-match. Also a property of the matcher.
- False accept rate (FAR): the proportion of impostor transactions the whole system accepts.
- False reject rate (FRR): the proportion of genuine transactions the whole system rejects.
- Equal error rate (EER): the operating point where FMR and FNMR are equal.
- Failure-to-enroll and failure-to-acquire (FTE, FTA): the share of users who cannot register, and of attempts where no usable sample is captured.
The BEAT project’s metrics deliverable draws the line this way: FMR and FNMR measure algorithmic matching errors, while FAR and FRR are system-level metrics that also include failures to acquire or compare. In practice, a system with an FNMR of 1% and an FTA of 3% may reject far more than 1% of real customers once capture failures are counted.
Why EER is a poor buying criterion
EER is popular because it compresses performance into one figure, which makes it easy to rank vendors on a slide. But almost no production system runs at the point where the two error rates are equal. A bank onboarding high-value accounts will accept more false rejects to push false accepts down. A consumer app with a cheap fallback may do the opposite. EER is useful for a quick comparison of matchers in a lab, not for predicting the experience at your chosen threshold.
Thresholds, ROC curves and DET curves
Every biometric comparison produces a score. The threshold you set converts that score into accept or reject, and it moves both error rates at once. According to NIST’s performance testing paper, false positive and false negative rates are compared across a range of thresholds using ROC or DET curves.
NIST’s IREX 10 page frames the two primary errors as a trade-off: false negatives deny access to authorized users, false positives grant access to unauthorized ones, and reducing one typically increases the other. It also states that a DET plot characterizes the full relationship between the two error rates. A DET curve plots both errors directly, usually on logarithmic axes, which makes differences at the low-error end, where fraud decisions live, much easier to see than a standard ROC chart.
How to read a curve
Find your target false accept rate on the horizontal axis, then read the false reject rate the system delivers at that point. Compare two vendors at that same point, not at their respective best figures. If a vendor supplies only one operating point, ask for the curve. If the curve stops well short of your target false accept rate, the vendor has not tested at the volume needed to support your claim.
Where thresholds meet fraud economics
The threshold is a business decision as much as a technical one. A strict setting cuts account takeover and synthetic identity risk, but it sends more genuine customers into manual review or abandonment. Teams in other high-risk sectors face the same arithmetic, as in how decision thresholds shape fraud exposure and legitimate customer access in payment processing. For identity verification, we recommend setting the threshold from a cost model: the average loss per successful fraud, the cost of a manual review, and the lifetime value of a customer lost to friction. Our guide on evaluating fraud control effectiveness walks through that measurement approach.
Lab accuracy versus production performance
A vendor result produced in a controlled test is not a forecast of your results. NIST’s paper makes clear that test results may not directly represent performance as assessed by system operators, and that biometric testing spans technology, scenario, and operational tests. Those categories are worth keeping straight:
| Test type | What it measures | What it cannot tell you |
|---|---|---|
| Technology test | Algorithm accuracy on a fixed, pre-collected dataset | How real users behave with real devices |
| Scenario test | Whole system with live capture in a simulated setting | Long-run behavior, adversarial attacks, your actual customer mix |
| Operational test | Performance in the live deployment | Comparability with other systems, since conditions are unique |
A technology test is repeatable, which is why public benchmarks are valuable. A scenario or operational test captures the capture step, the user interface and the decision policy, which is where many real failures originate. If you want to see how public benchmark data is best read, our piece on reading NIST face test results covers it in detail.
System-level evaluation includes the decision policy
Academic course material on statistical evaluation makes the same point: system-level evaluation must cover the entire transaction, including failure to acquire and the decision policy on how many attempts a user is allowed. Allowing three tries instead of one lowers the effective false reject rate, but it also gives an impostor three chances. Quote the metric with the attempt policy attached, or the number is not comparable.
What shifts performance: quality, population, modality and attacks
Several factors move the numbers, and a serious test report will say how each was handled. We describe these from operating experience in identity verification rather than from a single controlled study, so treat them as questions to put to a vendor, not as fixed effects.
- Sample quality. Blurred, poorly lit or partially framed captures raise false rejects and can distort scores. Capture guidance and quality checks at the front end often improve results more than a matcher upgrade.
- Population. Error rates can differ across age, skin tone, gender and other groups. A single aggregate rate can hide a group where the system performs much worse. Ask for results broken out by demographic group, and check that your own customer base resembles the test population.
- Modality. Face, fingerprint, iris, voice and behavioral signals have different error profiles and different failure modes. Voice is a case in point, which we examined in why voice biometrics alone fail in contact centers. Eye-based methods carry their own limits, covered in where eye tracking authentication holds up and fails.
- Device and environment. Camera quality, lighting, motion and background noise vary enormously across a consumer base, and a controlled lab removes nearly all of that variation.
- Spoofing and injection. Match accuracy says nothing about whether a printed photo, a replayed video or an injected deepfake is accepted. That is a separate measurement, covered next.
Presentation attack metrics sit beside match metrics
Liveness and presentation attack detection are evaluated with their own error rates, usually expressed as the share of attacks wrongly accepted and the share of genuine attempts wrongly flagged as attacks. These are reported separately from FAR and FRR, and a system can look excellent on one set and weak on the other. Our explainers on face liveness detection and iris liveness open-set gaps show why attack coverage in a test must match the attacks you actually face, including the injection techniques described in our capture integrity guidance for deepfake ID fraud.
What testing evidence to ask a vendor for
Strong evidence has recognizable features. Use the list below as a request template.
- Statistical rigor. Ask for confidence intervals, hypothesis tests and sample-size justification. The Springer text on computational methods in biometric authentication covers these methods for common biometric metrics, and its author, Dr. Michael E. Schuckers, argues that the development of biometric authentication has outpaced the statistical methods needed to evaluate it.
- Unseen data. NIST guidance on evaluation protocols says a protocol should test on previously unseen biometric signatures, so a system is not simply tuned to one dataset. Ask whether the test set was kept separate from training and tuning.
- A discriminating protocol. The same NIST document says a good evaluation should be neither too easy nor too hard, spreading scores enough to tell approaches apart. A test where every vendor scores near perfect is not informative.
- Whole-transaction results. Request FTE, FTA, FRR and FAR at your attempt policy, not only matcher-level FMR and FNMR.
- Operational evidence. Ask for results from live deployments similar to yours in volume, channel and customer mix.
- Attack testing. Request presentation attack and injection results with the attack types listed.
Representative data and generalization
A model that generalizes poorly will look excellent on its own data and degrade on yours. For financial-sector use, the practical question is whether the evaluation set reflects your customers, devices and fraud patterns. A discussion of representative evaluation datasets in banking fraud AI makes the case for monitoring and re-evaluating models after deployment, which applies equally to biometric matchers and anomaly layers. Our article on how anomaly detection supports identity verification shows how to combine them.
A worked example of reading the numbers
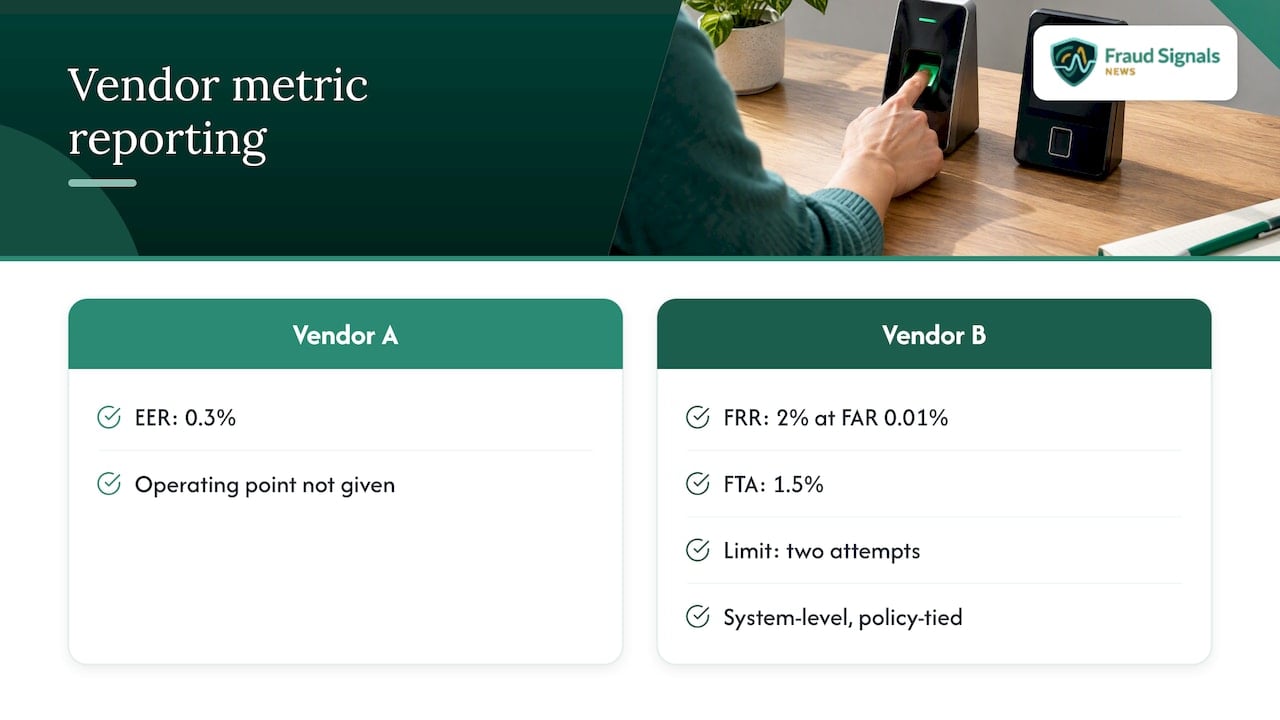
Imagine two vendors pitching a face-matching step for account opening. Vendor A reports an EER of 0.3%. Vendor B reports a false reject rate of 2% at a false accept rate of 0.01%, with an FTA of 1.5% and a stated limit of two attempts. Vendor A’s figure tells you nothing about your operating point. Vendor B’s figures are specific, system-level and tied to a policy, so you can model them against your own volumes.
Suppose you onboard 100,000 customers a month. At a 2% false reject rate plus 1.5% acquisition failures, roughly 3,500 genuine people hit friction before any fallback. If each costs a manual review, the cost is easy to compute and compare with the fraud avoided by running the stricter 0.01% false accept setting. This is illustrative arithmetic, not a benchmark, and the point is that only system-level figures at a stated threshold make the calculation possible.
Our perspective
We see the same failure repeatedly in this industry: buyers evaluate biometric systems on a single flattering accuracy claim, then discover in production that capture failures, attempt policies and attack coverage were never part of the number. Vendors are not always at fault. The vocabulary is genuinely tangled, and FAR, FMR and EER get used loosely even in procurement documents. The result is that organizations modernizing identity verification often replace an obsolete method with one they cannot actually measure.
Our position is pragmatic. Insist on system-level metrics, insist on the curve rather than the point, and insist on evidence that resembles your own traffic. Then keep measuring after launch, because fraudsters adapt and a threshold that was sound last year may be a low-assurance bypass today. Metrics are not a procurement formality. They are the control that tells you whether the control works.
— Carlos Ochoa
Going further with Fraud Signals News
If you are turning these metrics into a selection or tuning decision, our analysis of why biometrics reduce bank fraud and our guide to how biometrics satisfy compliance requirements pair operational results with the regulatory view. For a broader look at how the market is organized, see our overview of identity verification alternatives. Daon is among the established providers worth including on a shortlist. More coverage is on the Fraud Signals News homepage.
FAQ
What is a biometric value?
In performance testing, a biometric value is usually an empirical estimate of probability, such as the share of impostor attempts accepted. It is not a direct measurement against a known true value, so it carries statistical uncertainty that depends on how many attempts were tested.
What is the difference between FAR and FMR?
FMR measures how often the matching algorithm scores an impostor comparison as a match. FAR measures how often the whole system accepts an impostor, including the effect of capture failures and the attempt policy. Vendors sometimes use them as synonyms, so ask which one a figure refers to.
Which biometric metric matters most?
No single metric does, because accuracy is a trade-off between false accepts and false rejects. Choose the false accept rate your risk appetite requires, then compare the false reject rate, FTE and FTA vendors deliver at that point. A DET curve shows this relationship more completely than any one number.
Can I trust a vendor’s lab accuracy figures in production?
Not without more evidence. Technology tests on fixed datasets are useful for comparison, but they may not represent performance as your operators experience it. Ask for scenario or operational results, confidence intervals and testing on data the system had not seen.
Sources
- Fundamental issues in biometric performance testing, NIST
- IREX 10: Performance Metrics, NIST
- Description of metrics for the evaluation of biometric performance, BEAT project
- Computational Methods in Biometric Authentication, Springer
- An Introduction to evaluating biometric systems, NIST
- Biometrics Lecture 9: Statistical evaluation, university course material
Recommended

Onboarding Bot Detection: Stopping Automated Account Fraud
ID Security Features: What Each One Does and How to Check It