

TL;DR:
- Effective biometric and eKYC fraud control relies on independent lab reports, production validation, and traceable records. Vendors must provide at least five core metrics and detailed artifacts to ensure evaluation integrity, with thresholds tailored to risk levels. Continuous monitoring and separate testing for presentation and injection attacks are essential for maintaining operational security.
To evaluate industry fraud control effectiveness in biometric and eKYC systems, you need five core metrics at minimum: False Accept Rate (FAR/FMR), False Reject Rate (FRR/FNMR), Impostor Attack Presentation Accept Rate (IAPAR), Failure-to-Acquire (FTA), and throughput. No vendor claim is defensible without an independent lab PAD report per ISO/IEC 30107-3, or self-attestation backed by bootstrap analysis of stored verification transactions. Before accepting any biometric control into production, demand these artifacts:
- Lab report or self-attestation package with methodology, test dates, and model version
- Sample-size details (minimum pair counts and how they were drawn)
- Demographic breakdown of test subjects (age, skin tone, device type)
- Traceable subject-to-result records linking each subject ID to raw scores and decisions
- PAI species list with APCER/BPCER at the operating point
If a vendor cannot produce all five, the evaluation is incomplete.
Table of Contents
- What do FAR, FRR, IAPAR, and FTA actually measure?
- How do onboarding and authentication thresholds differ?
- How should you design your evaluation dataset?
- How do you compute confidence intervals and validate self-attestation?
- How do you validate lab performance in production?
- What attack types must your PAD and injection testing cover?
- What should vendor reports contain, and how do you govern procurement?
- Key Takeaways
- The gap between vendor claims and what actually holds up in production
- Useful sources
- FAQ
What do FAR, FRR, IAPAR, and FTA actually measure?
These metrics are the shared vocabulary between your team and every vendor. Misaligned definitions are where evaluations fail silently.
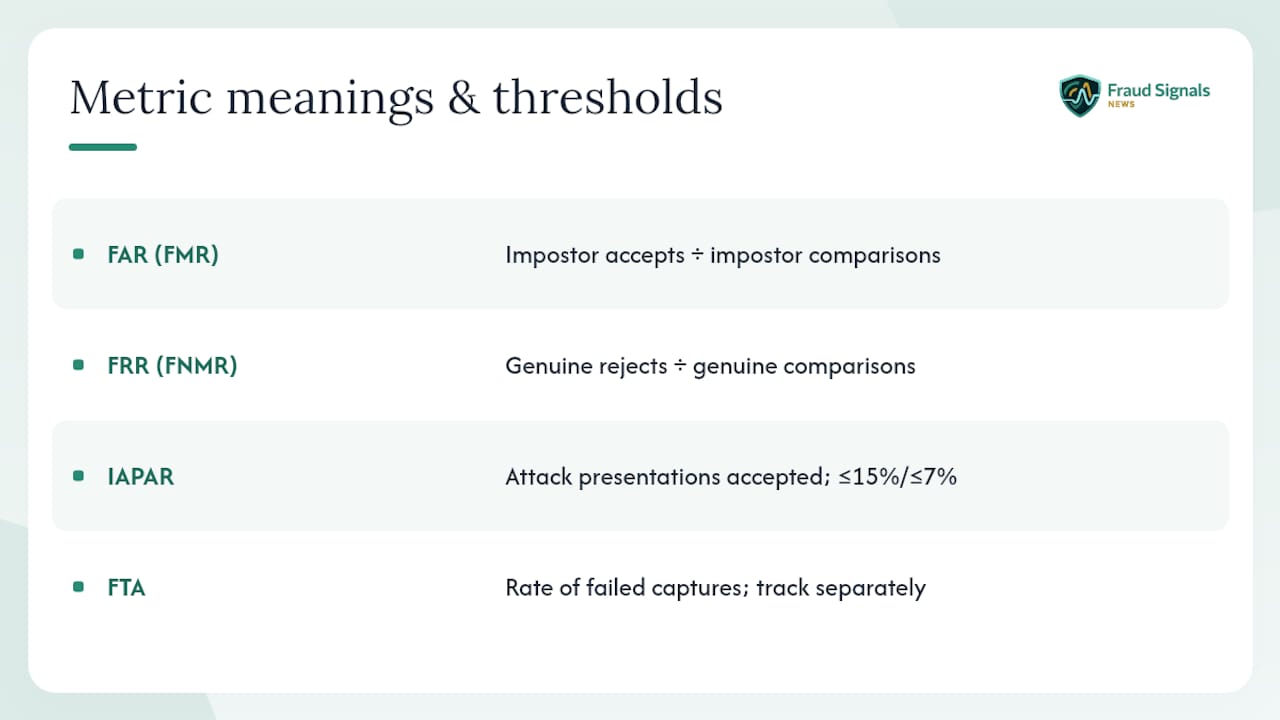
False Match Rate (FMR) / False Accept Rate (FAR): The proportion of impostor comparisons that the system incorrectly accepts. Formula: FMR = False Accepts ÷ Total Impostor Comparisons. In a dataset with 10,000 impostor pairs and 5 false accepts, FMR = 0.05%.
False Non-Match Rate (FNMR) / False Reject Rate (FRR): The proportion of genuine comparisons incorrectly rejected. Formula: FNMR = False Rejects ÷ Total Genuine Comparisons. With 1,000 genuine pairs and 30 rejections, FNMR = 3%.
IAPAR (Impostor Attack Presentation Accept Rate): The rate at which presentation attacks (printed photos, masks, deepfake injections) are accepted as genuine. Per the FIDO Biometric Certification Program, acceptable IAPAR thresholds are ≤15% for BioLevel 1 and ≤7% for BioLevel 2. IAPAR maps directly to APCER in ISO/IEC 30107-3 terminology.
Failure-to-Acquire (FTA): The rate at which the system cannot capture a usable biometric sample. FTA must be tracked separately from FAR because a system that rejects poor-quality captures before comparison artificially inflates its apparent accuracy. Counting FTA events as false rejects is one of the most common measurement errors in vendor reports.
Throughput measures decisions per unit time under realistic load. A system with excellent FMR that degrades under peak traffic creates operational risk that no accuracy metric captures.
Statistic callout: FIDO specifies FAR requirements that vary based on assurance level, and sets upper bounds on FRR for certain BioLevel/IdVLevel combinations.
How do onboarding and authentication thresholds differ?
Onboarding and authentication are different risk events and require risk-appropriate PAD testing and IAPAR thresholds. High-risk onboarding demands lower IAPAR and FAR thresholds with independent lab evidence; medium- and low-risk scenarios allow progressively higher thresholds and may accept self-attestation or operational monitoring accordingly.
Pro Tip: Map your FAR/IAPAR threshold directly to downstream exposure. A $50,000 wire transfer and a $10 in-app purchase do not share the same acceptable false-accept rate. Tie threshold selection to the maximum loss per fraudulent transaction, not to what the vendor’s default operating point happens to be.
For sector-specific risk mapping, banking and fintech teams face distinct regulatory expectations that should anchor threshold decisions.
How should you design your evaluation dataset?
Dataset design determines whether your FAR/FRR estimates are defensible or decorative. The AWS metrics guidance provides practical sample-size ranges that map directly to what conclusions you can actually draw.
| Dataset size | Confidence level | What you can conclude |
|---|---|---|
| 100–1,000 pairs | Feasibility only | Directional signal; wide confidence intervals |
| 1,000–10,000 pairs | Moderate | Variability measurement; demographic subgroup trends |
| 10,000+ pairs | Operational | Generalizability; production-grade FAR/FRR estimates |
For genuine pairs, draw from stored verification transactions where the same subject enrolled and later authenticated. For impostor pairs, cross-match subjects who did not enroll together. Non-mated comparison counts grow quadratically with subject count, so 200 subjects yield roughly 19,900 impostor pairs.
Metadata you must record for every test record:
- Subject ID (pseudonymized, linkable to raw scores)
- Device model and OS version
- Camera metadata (resolution, frame rate, capture quality flag)
- Model version and inference timestamp
- Decision output and raw similarity score
ISO empirical testing guidance requires bias-reduction protocols and documented recording procedures. A dataset that cannot be audited against these requirements is not a dataset; it is a demo.
Sampling checklist: Include subjects across age bands (18–30, 31–50, 51+), skin tone ranges (Fitzpatrick scale I–VI), and device tiers (flagship, mid-range, low-end). Any demographic gap in your test set is a gap in your fraud control coverage.
How do you compute confidence intervals and validate self-attestation?
Statistical rigor separates a defensible evaluation from a vendor slide deck.
- Compute transaction-level FMR and FNMR from your test dataset using the formulas in Section 2. Exclude FTA events from both numerator and denominator before computing match-rate metrics.
- Calculate the upper-bound confidence interval at 80% or 90% using a Wilson score or Clopper-Pearson interval. FIDO uses upper-bound rules because the worst-case rate, not the point estimate, is what your risk model must survive.
- Run a bootstrap distribution (1,000–10,000 resamples) on your test pairs. Compare the resulting FMR/FNMR distribution to the vendor’s self-attested values. If the vendor’s claimed FAR falls outside the 90th percentile of your bootstrap distribution, the self-attestation is not validated.
- Reweight your offline sample when it differs from production demographics. A test set skewed toward younger, high-end-device users will underestimate FRR for older users on low-end hardware.
- Flag and separately report any subgroup where FNMR exceeds the population-level estimate by more than a factor of two.
Statistic callout: Self-attestation is only defensible when vendor-supplied test artifacts can be validated against independent lab distributions via bootstrap comparison, per FIDO Biometric Certification Program guidance.
Common pitfalls: Counting FTA in FAR inflates apparent accuracy. Reporting only point estimates without CIs hides uncertainty. Accepting a vendor’s demo dataset as a proxy for your production population is the single fastest way to deploy a control that fails in the field.
How do you validate lab performance in production?
Lab results and production performance diverge. The gap is not a surprise; it is a measurement gap you must close actively.
Run an A/B style validation using stored verification transactions from a controlled rollout window. Compare FAR/FNMR and IAPAR across rolling 7-day and 30-day windows. A drift of more than 20% from baseline in any metric warrants an alert and cohort investigation before expanding rollout.
Monitoring checklist:
- Metric cadence: daily for FAR/FNMR, weekly for IAPAR and FTA
- Alert thresholds: set at 1.5× baseline for FAR, 2× baseline for FNMR
- Cohort segmentation: device OS, geography, enrollment age, camera model
- Minimum sample per alert window: 500 transactions per cohort before triggering an alert
Audit-trail requirements for every production decision: session ID, model version, liveness score, raw similarity score, reviewer decision (if escalated), and retention period. Compliance teams should confirm retention rules align with applicable US data-handling expectations.
Pro Tip: Stage your rollout at 5%, 20%, and 100% of traffic. At each gate, run a human-review sample of 2–5% of decisions to maintain oversight. A 2% sample on 10,000 daily transactions means 200 manual reviews per day, which is operationally manageable and statistically meaningful.
For deeper operational monitoring patterns, authentication-focused coverage on Fraud Signals News covers drift detection and escalation design in detail.
What attack types must your PAD and injection testing cover?
Presentation attacks and injection attacks are distinct threat vectors requiring different evidence and different controls. Conflating them is a procurement error that leaves real gaps. Per ISO/IEC 30107-3 and independent lab validation requirements, APCER and BPCER must be reported together because a low APCER achieved by rejecting most users (high BPCER) simply shifts risk into manual review rather than eliminating it.
| Attack class | Test method required | Evidence artifact |
|---|---|---|
| Print attack (2D photo) | ISO/IEC 30107-3 S2/S3 lab scenario | APCER/BPCER at operating point |
| Replay attack (screen/video) | Accredited PAD lab, device-level test | PAI species report |
| 3D mask | S3 scenario, silicone/rigid mask | Lab report with mask types listed |
| Deepfake injection | Virtual camera simulation, frame injection | Injection test methodology doc |
| Virtual camera / stream replacement | Device integrity check, cryptographic frame binding | Architecture attestation |
Cryptographic frame binding and device integrity signals are the practical defense against injection attacks, which PAD lab testing alone does not address. Require vendors to document their server-side, on-device, or hybrid inference architecture and show evidence of runtime attestation.
- Demand a named PAI species list (not just “print and replay”) in every vendor report
- Require IAPAR at the specific operating point you will deploy, not at a vendor-chosen threshold
- Confirm injection attack coverage is tested separately from PAD, with its own methodology section
What should vendor reports contain, and how do you govern procurement?
A vendor report that omits model version, test dates, or demographic breakdown is not evidence; it is marketing. Require the following as non-negotiable RFP gates:
- Test dates and model version (algorithm version, not just SDK version)
- Sample sizes and demographic breakdown by age, skin tone, and device tier
- PAI species list with APCER/BPCER at the deployed operating point
- CI method (Wilson, Clopper-Pearson, or bootstrap) and upper-bound values
- Raw-score retention policy and subject-ID traceability statement
When vendors self-attest, require the underlying test artifacts and run the bootstrap validation described in Section 5. Scored RFPs with measurable pass/fail criteria mapped to NIST IAL levels are more defensible than qualitative assessments.
Governance checklist for contracts:
- Model-change notification SLA (72-hour minimum for algorithm updates)
- Data residency and biometric template storage (vectors, not raw images)
- SOC 2 Type II report and ISO 27001 certification
- Encryption standards: AES-256 at rest, TLS 1.3 in transit, per vendor security diligence guidance
- Incident notification timeline (align to applicable US breach-notification expectations)
- Third-party penetration test results, dated within 12 months
For KYC-regulated onboarding flows, data-handling clauses carry additional weight because biometric templates are sensitive personal data under several US state laws.
Key Takeaways
Biometric and eKYC fraud control effectiveness is only defensible when it rests on independent lab evidence, production validation, and traceable audit records, not vendor claims alone.
| Point | Details |
|---|---|
| Demand five core metrics | Require FAR/FMR, FRR/FNMR, IAPAR, FTA, and throughput from every vendor before procurement. |
| Match thresholds to risk tier | High-risk onboarding needs IAPAR ≤7% (BioLevel 2); low-risk authentication can accept IAPAR ≤15% (BioLevel 1). |
| Size your dataset correctly | Use 1,000–10,000 pairs for variability measurement; 10,000+ pairs for operational, production-grade, generalizable estimates. |
| Separate PAD from injection testing | PAD lab reports cover presentation attacks; injection attacks require cryptographic frame binding and device integrity evidence separately. |
| Monitor production drift | Track FAR/FNMR daily and IAPAR weekly; alert at 1.5× baseline and maintain 2–5% human-review sampling throughout rollout. |
The gap between vendor claims and what actually holds up in production
The most persistent failure mode in biometric procurement is not choosing the wrong algorithm. It is accepting the wrong evidence. Teams routinely approve vendors based on demo datasets that bear no resemblance to their production population, then discover the performance gap six months into a live deployment when fraud losses have already accumulated.
The industry’s fixation on headline FAR numbers obscures what actually matters operationally: the upper-bound CI at your specific operating point, across your specific demographic mix, on your specific device fleet. A vendor that reports 0.01% FAR on a curated lab dataset of 500 pairs is not giving you information you can act on. A vendor that supplies a bootstrap-validated self-attestation with 10,000 production pairs, demographic subgroup breakdowns, and a named PAI species list is.
Injection attacks deserve particular attention because they are systematically underweighted in procurement. Most RFPs ask for ISO/IEC 30107-3 PAD evidence and stop there, leaving virtual camera injection and deepfake frame replacement entirely unaddressed. Cryptographic frame binding and runtime device attestation are not optional features; they are the controls that close the gap PAD testing cannot reach.
The biometric controls that actually reduce bank fraud share a common trait: they were evaluated against production-representative data, monitored continuously, and governed by contracts that required model-change notification before algorithm updates went live. That combination, not any single metric, is what separates a defensible control from a liability.

Useful sources
- Biometrics-Requirements-v4.0-fd-20240522.pdf
- Empirical performance testing of biometric systems (ISO standard summary)
- Metrics for evaluating an identity verification solution (AWS blog)
- Liveness detection biometric KYC for platforms and audit (gruv.ai)
- Liveness detection deep dive: ISO 30107-3, APCER, BPCER, and architecture patterns (Quantilence)
- How should teams evaluate identity verification vendors without relying on sales? (NHIMG)
- A guide to evaluating trust in identity verification solutions (ShuftiPro)
FAQ
What is the minimum sample size to evaluate biometric fraud controls?
Use at least several thousand genuine and impostor pairs to measure variability and obtain production-grade FAR/FNMR estimates with defensible confidence intervals, following AWS identity verification metrics guidance.
How does IAPAR differ from FAR in biometric testing?
FAR measures the rate of incorrect matches between two biometric samples, while IAPAR specifically measures the rate at which presentation attacks (spoofs, masks, deepfakes) are accepted as genuine; both are required, and neither substitutes for the other.
When is vendor self-attestation acceptable instead of an independent lab report?
Self-attestation is acceptable for lower-risk authentication flows only when the vendor supplies test artifacts sufficient for an independent bootstrap comparison against lab distributions, as specified in FIDO Biometric Certification Program requirements.
What is the difference between PAD testing and injection attack testing?
PAD testing per ISO/IEC 30107-3 covers physical presentation attacks (printed photos, masks, replay videos); injection attacks, such as virtual camera spoofing and deepfake frame replacement, require separate controls including cryptographic frame binding and device integrity attestation.
How often should production biometric metrics be monitored?
Track FAR and FNMR daily, IAPAR and FTA weekly, and alert when any metric exceeds 1.5× its established baseline; maintain a 2–5% human-review sampling fraction throughout the rollout period.
Recommended

Fraud Teams: NIST Aligned VPN Detection for Onboarding, Score First

Prevent a Biometric Breach: 6 Operational Controls for Identity Teams