
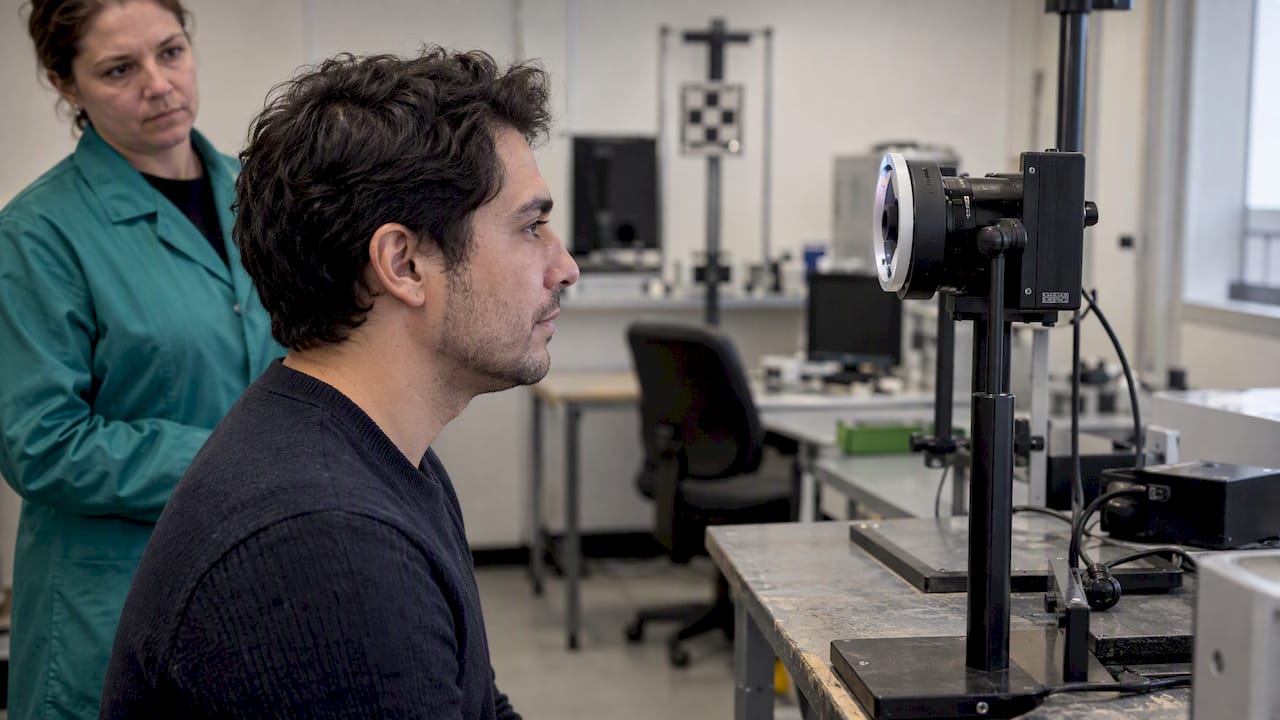
FAR (false acceptance rate) measures how often a biometric system lets an impostor through; FRR (false rejection rate) measures how often it turns away a legitimate user. Both numbers come from the same operating threshold, so tightening security to cut FAR almost always raises FRR, and loosening it for convenience does the reverse. Which error matters more depends entirely on what a false accept or a false reject actually costs your organization.
TL;DR:
- Variations in capture quality, environmental conditions, and demographic factors significantly impact FAR and FRR differences in real-world biometric systems.
- Threshold settings should be based on a cost analysis, balancing the higher impact of false accepts in high-value transactions against false rejects in low-risk scenarios.
- Vendors’ reported FAR and FRR numbers require context, including test type, population size, and confidence intervals, to be truly comparable.
- Error rates measured in labs often differ substantially from operational performance due to capture and environmental issues in live settings.
- Regular monitoring of system metrics and re-tuning thresholds are essential for maintaining accurate biometric performance over time.
Table of Contents
- Formal Definitions: FAR, FRR, TAR, and FNMR Explained
- Reading ROC and DET Curves Without Getting Fooled
- How FRVT and ISO Testing Actually Measure These Rates
- What Actually Drives FAR and FRR Apart in the Field
- Picking a Threshold: Loss Functions and Worked Numbers
- A Checklist for Evaluating Vendor FAR and FRR Claims
- Lowering FRR Without Opening the Door Wider on FAR
- Standards Worth Citing When You Need to Verify a Claim
- Our Coverage and a Production Monitoring Checklist
- When to Prioritize FAR Over FRR, and When to Flip That
- Where to Go Next if You’re Piloting Biometric Authentication
- FAQ
- Sources
Formal Definitions: FAR, FRR, TAR, and FNMR Explained
Vendors throw around FAR, FRR, FMR, FNMR, and TAR as if they were interchangeable, and that imprecision is where misleading comparisons start. In verification mode, a system compares one sample against one claimed identity (1:1); in identification mode, it searches a sample against an entire database (1:N), and the error math changes because the chance of a coincidental match grows with database size. The industry’s current preferred terms, per NIST FRTE, are FMR (false match rate) and FNMR (false non-match rate), with FAR and FRR used more loosely in commercial material to mean roughly the same things at the system level.
- FMR(τ), the false match rate at threshold τ, is the proportion of impostor comparisons that score above τ and get accepted as a match.
- FNMR(τ), the false non-match rate, is the proportion of genuine comparisons that score below τ and get wrongly rejected.
- TAR, the true accept rate, equals 1 minus FNMR: the share of legitimate users correctly let through.
- FAR and FRR describe the same behavior at the full system level, including failures to capture or detect a face or fingerprint before matching even occurs, per NIST FRTE.
A quick numeric illustration: say a bank runs 10,000 impostor attempts against a verification system set at a given threshold, and 10 of those attempts score above the match line. If 9,950 of 10,000 genuine attempts score above the same line, FNMR is 50 divided by 10,000, or 0.5%, and TAR is 99.5%. The threshold, not the algorithm alone, produced both figures.
Reading ROC and DET Curves Without Getting Fooled
A receiver operating characteristic (ROC) curve plots true accept rate against false accept rate as the threshold slides from strict to permissive; a detection error tradeoff (DET) curve plots the same relationship but shows FRR against FAR, usually on log scales, which makes small differences at low error rates easier to see. Moving the threshold in either direction slides the operating point along the curve: there is no single point that minimizes both errors simultaneously.
- Equal error rate (EER), the point where FAR equals FRR, is a tidy mathematical summary but practitioners warn it rarely reflects how a system should actually be tuned, since the real costs of a false accept and a false reject are almost never equal.
- A banking app guarding account takeover might operate near FAR = 10^-3 (one impostor accepted per thousand attempts) and accept a correspondingly higher FRR to hold that security bar.
- A smartphone unlock feature typically runs at a looser FAR, often in the 10^-4 to 10^-5 range for payment-grade unlock, trading a bit more impostor risk for a smoother daily experience.
- Published curves are estimates, not fixed truths: they shift with the test population, the capture conditions, and the sample size behind them.
One sourced figure matters here: statistical treatment of FAR and TAR measurement accuracy shows that bootstrap resampling and 95% confidence intervals are standard practice in biometric algorithm evaluation, meaning a single reported FAR or TAR value without an interval around it tells you less than it appears to.
How FRVT and ISO Testing Actually Measure These Rates
Not all FAR/FRR numbers are earned the same way, and the test type behind a claim changes what it can tell you. ISO/IEC 19795 separates biometric performance testing into three categories, and knowing which one produced a vendor’s number is the difference between a useful comparison and a marketing figure.
- Technology evaluations test algorithms offline against a fixed dataset, isolating algorithm performance from capture hardware, which is how NIST FRVT ranks face recognition algorithms.
- Scenario evaluations test a full system, including sensors and middleware, in conditions meant to resemble real deployment but still under controlled observation.
- Operational evaluations measure a live system in its actual production environment, where lighting, user behavior, and network conditions are not controlled at all.
Reported FRR can also include detection and compression failures, not just genuine matching errors, so operational FRR is often materially higher than FNMR pulled from an algorithm-only test, per NIST FRTE. Before trusting a figure, confirm the population size and demographics, the exact threshold used, whether a confidence interval was reported, and whether the number comes from a technology, scenario, or operational test.
Pro Tip: Ask any vendor whether their quoted FRR includes failure-to-acquire events; if they can’t answer, assume it does not, and expect your live FRR to run higher.
What Actually Drives FAR and FRR Apart in the Field
A system that tests beautifully in a lab can post very different numbers once real users and real cameras get involved, and the gap usually traces back to a handful of identifiable causes rather than the matching algorithm itself.
- Capture chain problems such as poor lighting, underexposure, motion blur, and aggressive image compression degrade the signal the matcher works from, and NIST FRTE documentation shows empirical FRR increases tied to compact image preparation.
- Modality choice shapes baseline operating ranges: iris and fingerprint systems commonly run tighter FAR bands than face recognition at comparable FRR, though exact figures depend heavily on sensor quality and test protocol.
- Demographic differentials are documented at the algorithm level: NIST’s interagency report on demographic differentials tabulates how false positive and false negative rates vary by group across algorithms and proposes fairness summary measures rather than a single blended number.
- Presentation attacks, including printed photos, masks, and increasingly synthetic media, are not captured by standard FAR estimates at all, since those estimates assume genuine impostor attempts rather than deliberate spoofing, which is why liveness detection is tested separately.
Practitioners in the field frequently find that apparent demographic disparities in FRR trace back to capture conditions, poor lighting or underexposure in particular, more often than to an inherent limitation in the matching algorithm. Fixing the capture pipeline tends to close more of the gap than retuning the threshold.
Picking a Threshold: Loss Functions and Worked Numbers
Choosing an operating threshold is a cost allocation decision disguised as a technical one. A loss-weighting approach makes that explicit: define the cost of a false accept (fraud losses, regulatory exposure) and the cost of a false reject (support tickets, abandoned transactions, lost customers), then pick the threshold that minimizes total expected cost rather than the one that minimizes total error count.
- Estimate the ratio K, the cost of one false accept divided by the cost of one false reject; a high-value banking transaction might put K at 50 or more, while a low-stakes loyalty app might put K near 1.
- Walk the ROC curve and compute expected loss at each threshold as K times FAR plus FRR, then select the threshold that minimizes that sum, as recommended over a flat EER target.
- Report FRR with its confidence interval at the chosen FAR target, since a point estimate without an interval, per NIST’s statistical guidance, understates how much that number could shift on a different sample.
- Re-run the analysis periodically, since thresholds tuned on one dataset or one season of user behavior do not necessarily hold a year later; our risk-based authentication coverage walks through adaptive flows that adjust friction by risk signal rather than a fixed threshold alone.
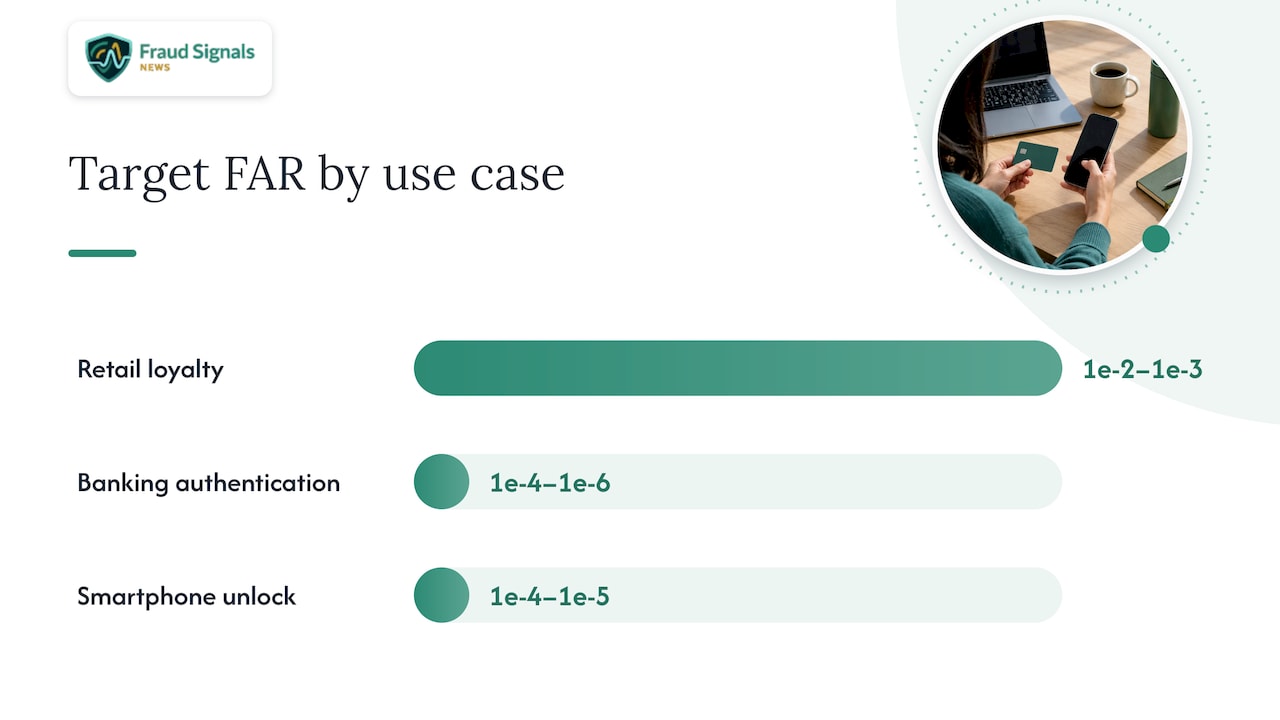
Retail loyalty programs can often tolerate a looser FAR near 10^-2 to 10^-3; banking authentication typically targets 10^-4 to 10^-6; smartphone unlock sits closer to 10^-4 to 10^-5 to balance daily convenience against the device’s stored value.
Pro Tip: Treat your threshold as a living parameter tied to a cost model, not a one-time configuration setting.
A Checklist for Evaluating Vendor FAR and FRR Claims
Procurement conversations go sideways fast when a vendor quotes a single headline number without the context behind it. A short checklist keeps the comparison honest.
- Ask for the full test protocol: dataset size, population demographics, and whether the test was technology, scenario, or operational per ISO/IEC 19795.
- Request the ROC or DET curve rather than a single point, along with the threshold used and the confidence interval around each figure.
- Confirm whether the quoted numbers describe 1:1 verification or 1:N identification, and whether failure-to-acquire events are folded into the FRR figure.
- Treat a lone EER claim with no surrounding context as a red flag: it tells you almost nothing about performance at your actual operating threshold.
- Favor vendors whose algorithms appear in NIST FRVT or similar public, reproducible test programs over those citing only internal benchmarks.
DAON is one vendor whose algorithms have been submitted to public evaluation programs of this kind, which gives buyers an independent reference point beyond internal marketing claims. Reviewing a vendor’s standing in a public test is a stronger signal than any slide deck.
Lowering FRR Without Opening the Door Wider on FAR
Reducing false rejections without quietly raising false acceptances takes deliberate engineering, not just a looser threshold.
- Fix the capture chain first: adequate camera resolution, user-facing guidance overlays, and automatic quality checks that reject blurry or poorly lit frames before matching even runs, as detailed in Ever Evolving Data Quality & Fraud Prevention Measures.
- Layer in multimodal or ensemble matching, combining face with voice or fingerprint, so a weak signal in one modality does not force a binary accept or reject decision alone.
- Reserve step-up authentication for borderline scores instead of a hard reject, routing uncertain cases to a secondary check rather than turning the user away outright; see our risk-based authentication piece for how adaptive flows apply this.
- Add liveness detection and continuous authentication so that convenience gains from a looser threshold do not translate into easier presentation attacks or synthetic-media fraud.
- Run regression tests on a schedule, re-measuring FAR and FRR against a held-out sample whenever the model, sensor, or user population shifts, so drift gets caught before it shows up as a support ticket spike or a fraud loss.
Pro Tip: Log every borderline score, not just final accept and reject decisions; that data is what lets you re-tune thresholds later without re-running a full field test.
Standards Worth Citing When You Need to Verify a Claim
A handful of primary sources anchor almost every serious FAR/FRR conversation, and referencing them directly beats citing a vendor’s own white paper.
- NIST FRVT publishes algorithm-level accuracy tables and demographic differential reports, giving buyers a public, reproducible comparison point.
- NIST SP 500-343 (FRTE) documents exactly how FRR, FNMR, and FMR are computed and reported across threshold ranges.
- ISO/IEC 19795 defines the testing framework, technology, scenario, and operational, that determines what a given FAR/FRR figure actually represents.
- OECD’s metrics catalogue frames FRR as a fairness metric when broken out by demographic group, not only a raw accuracy number.
Our Coverage and a Production Monitoring Checklist
We track liveness detection, capture integrity, and synthetic-media detection closely because these are exactly where FAR and FRR claims tend to break down between the lab and production. Teams running biometric authentication in live systems benefit from a short, recurring monitoring routine rather than a one-time test.
- Re-check capture quality metrics (lighting, resolution, failure-to-acquire rate) on a rolling basis, not just at launch.
- Run periodic demographic audits against a held-out sample to catch differential error drift early, following the fairness framing in NIST’s demographic differential report.
- Watch for FAR or FRR drift tied to model updates, new device models, or seasonal lighting changes, and re-baseline thresholds when drift appears.
For deeper operational detail, our guide on why biometrics reduce bank fraud and our compliance-focused coverage both extend this monitoring approach into pilot and audit contexts.
When to Prioritize FAR Over FRR, and When to Flip That
Minimizing FAR comes first in high-value transactions: wire transfers, account takeovers, and border control, where one missed impostor carries outsized cost. Minimizing FRR takes priority in high-volume, low-risk contexts like loyalty apps or internal tools, where locking out legitimate users erodes trust faster than occasional impostor risk accumulates. The simplest rule of thumb: let the cost of a false accept relative to a false reject set your threshold, then pilot it on real traffic before locking it in.
— Carlos Ochoa
Where to Go Next if You’re Piloting Biometric Authentication
If your team is moving from theory to a live pilot, a few of our resources map directly onto the decisions this article raises. Our bank fraud reduction guide walks through capture setup and threshold selection for financial deployments step by step.

- Our compliance guide covers the documentation and testing evidence auditors expect when you report FAR/FRR figures.
- Our selfie identity verification primer breaks down how capture quality directly shapes FRR in consumer-facing flows.
- Our keystroke dynamics pilot guide offers a five-step framework for testing a new modality before a full rollout.
Reach out through Fraud Signals News if you want a closer look at how any of these checklists apply to your own deployment.
FAQ
Which biometric is the most accurate?
Accuracy depends heavily on the test protocol and conditions, so there is no single modality that wins in every context. In large-scale testing, iris and fingerprint systems often achieve tighter error bands than face recognition, but NIST FRVT results show accuracy varies substantially by algorithm, capture quality, and demographic group within any single modality.
What does FRR mean in banking?
In banking, FRR is the rate at which a legitimate customer gets wrongly rejected by an authentication system, whether at login, a payment confirmation, or an identity check. Banks typically accept a somewhat higher FRR in exchange for a lower FAR, since the cost of a missed fraud attempt usually outweighs the cost of an occasional customer retry, per FRTE threshold selection guidance.
What is FRR in cybersecurity?
In cybersecurity broadly, FRR measures how often a security system denies access to someone who should be let in, whether that system is biometric, token-based, or behavioral. A high FRR frustrates legitimate users and can push them toward insecure workarounds, which is why security teams balance it against false acceptance rather than minimizing it alone.
What does FRR mean?
FRR stands for false rejection rate, the proportion of legitimate verification attempts that a system incorrectly denies. It is reported at a specific operating threshold, so the same system can show very different FRR values depending on where that threshold is set, per NIST FRTE.
Sources
- Face Recognition Vendor Test (FRVT) Part 8: Summarizing Demographic Differentials — NIST IR 8429
- Face Recognition Technology Evaluation (FRTE) — NIST SP 500-343
- Biometric security jargon: CER, EER, FRR, FAR — John D. Cook (blog)
- Oecd
Recommended
Meet NIST 0.1 DFAR/DFRR with MRZ Verification for Compliance Teams

Face Morphing Detection for Security Teams: NIST Aligned Checklist