

TL;DR:
- Fraud prevention ROI is calculated by dividing the net benefits by the total costs, requiring accurate baseline and deduplication. A credible measurement reports dollars saved, operational efficiency, and false-positive costs, with quarterly reviews to maintain accuracy. Presenting a simple three-line income statement with specific dollar figures increases leadership’s confidence and supports budget approval.
Fraud prevention ROI follows a single formula: (Total benefits − Total costs) ÷ Total costs. To apply it defensibly, you need five immediate actions: establish a 12-month adjusted baseline, deduplicate prevented events so you count each fraud actor once, build a full total cost of ownership (TCO) that includes analyst headcount and model tuning, select an attribution method (holdout, matched control, or time-series), and instrument your logging so every blocked decision is tagged and auditable. This week, pull 12 months of confirmed fraud-loss data, assign a data owner, set your measurement window, and schedule a stakeholder alignment call. Those four moves get you from zero to a defensible first draft in under 30 days.
Table of Contents
- What does a successful fraud ROI measurement look like?
- The ROI formula and a worked example you can copy
- How to measure fraud prevention ROI step by step
- Which KPIs should every fraud team track?
- How do you prove causality, not just correlation?
- What does total cost of ownership actually include?
- How do you translate ROI results into language leadership understands?
- What measurement mistakes do fraud teams make most often?
- How do you keep measurement defensible over time?
- Key Takeaways
- What experienced fraud leaders do differently
- Useful sources and tools to read next
- FAQ
What does a successful fraud ROI measurement look like?
A positive result is not just a ratio above 1:1. It means you can show finance a dollar figure for losses avoided, a reduction in chargeback rate, lower manual-review volume, and a false-positive rate that is not quietly eroding approval revenue.
What to expect from a well-run program:
- Confirmed fraud losses avoided, expressed in dollars, compared against the same period in the prior year adjusted for portfolio growth
- Operational savings from reduced manual review, quantified as analyst hours multiplied by fully loaded labor cost
- Chargeback rate and false-positive rate trending in opposite directions (fraud down, approvals up)
Recommended cadence: Use the first 12 months to establish your baseline. Run quarterly checkpoint reviews at months 3, 6, 9, and 12. For new tool deployments, add a 60–90 day short-term review window to catch early drift before it compounds.
Start measuring these three things first: confirmed fraud losses by channel, manual-review volume in hours per month, and false-positive rate by decision type.

The ROI formula and a worked example you can copy
The formula is straightforward. What makes it defensible is the discipline applied to each input.
ROI = (Total Benefits − Total Costs) ÷ Total Costs
- Total Benefits = prevented fraud losses + chargebacks avoided + operational savings (manual review reduction, analyst time freed) + recovered funds
- Total Costs = license fees + integration engineering + model tuning + analyst headcount + manual review labor + customer remediation + vendor service fees
Worked example
Assume a mid-size U.S. fintech running a transaction fraud prevention program for 12 months:
Two adjustments matter here. First, the prevented fraud figure is deduplicated: multiple blocked attempts by the same fraud actor count as one prevented loss, not ten. Second, the baseline is adjusted upward by 20% to account for unreported fraud, a standard practitioner approach when confirmed-loss data underrepresents actual exposure. The manual review saving reflects a real operational outcome: cutting review volume to roughly 1% of transactions can generate that level of cost reduction in a program of this scale.
For multi-year programs, amortize capital and implementation costs over the expected useful life of the tool (typically 3 years for platform integrations) and annualize benefits by dividing the measurement-period total by the number of months, then multiplying by 12.

How to measure fraud prevention ROI step by step
This is the repeatable process. Follow it in order; skipping steps produces numbers finance will challenge.
-
Establish a defensible baseline. Pull 12 months of confirmed fraud losses, adjusted for portfolio changes (volume growth, new products, channel mix shifts). Fraud loss measurement (FLM) exercises, which test transactions against external data in a statistically valid sample, offer the most robust baseline method. Apply a 20–30% uplift to account for unreported fraud.
-
Deduplicate and classify prevented events. Vendor-reported blocked totals routinely include duplicate attempts from the same actor. Build a deduplication rule that groups attempts by device fingerprint, account identifier, or IP cluster, and count each fraud actor once. Tag each blocked event by fraud type (account takeover, synthetic identity, payment fraud) so benefits can be attributed to specific controls.
-
Quantify direct benefits. Prevented losses are the difference between your counterfactual (what losses would have been without the intervention) and actual confirmed losses. Add chargebacks avoided, net of any dispute processing costs, and any recovered funds from tertiary prevention.
-
Quantify operational benefits. Convert analyst hours saved into dollars using fully loaded labor cost. If automation reduced manual review volume, calculate the delta in hours per month and multiply by the blended hourly rate. Include customer support time saved from fewer false-positive remediation calls.
-
Pick an attribution approach and design a holdout where feasible. Randomized holdouts are the most defensible method. Where a holdout is not feasible, use a matched control group or a time-series comparison against a pre-intervention period. Document the attribution window explicitly.
-
Validate data quality and instrument the measurement. Every blocked decision should be logged with a timestamp, rule or model version, outcome tag, and channel identifier. Incomplete logging is the single most common reason ROI numbers fail audit review.
Pro Tip: Before you finalize your baseline, run a data-quality check on your fraud-loss records. Missing dispute outcomes, unresolved chargebacks, and untagged manual reviews are the three most common gaps that cause baselines to understate actual losses.
Which KPIs should every fraud team track?
Finance wants dollars. Operations wants throughput. The metrics below serve both audiences, and each has a clear measurement method.
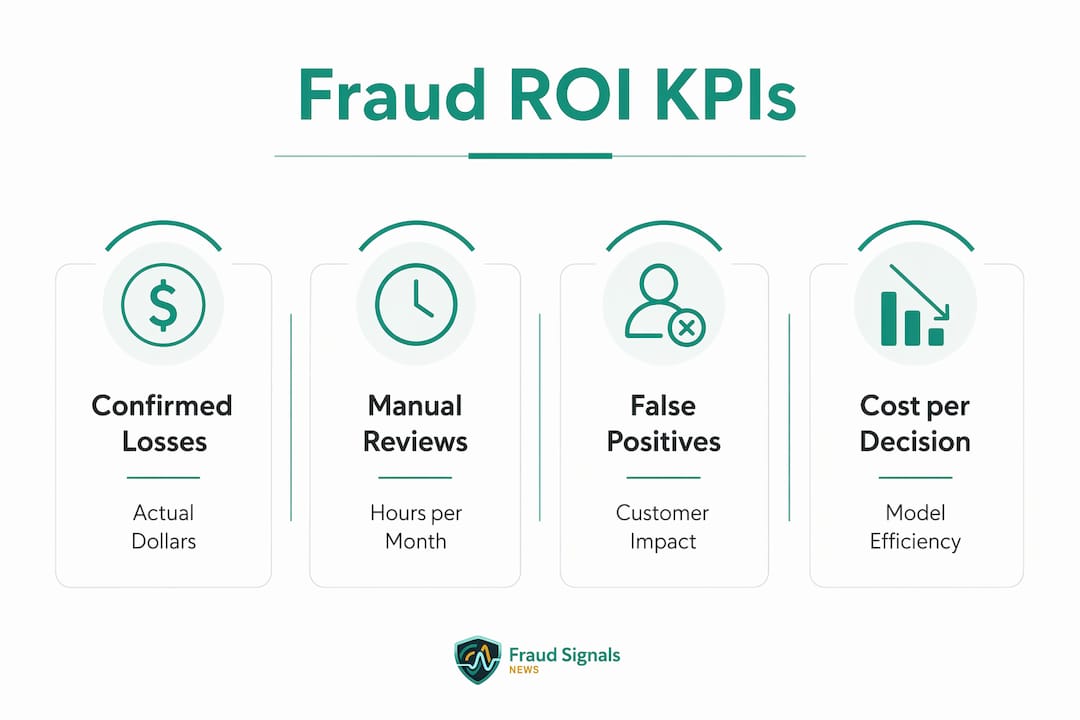
| KPI | Definition | How to Measure | Example Target |
|---|---|---|---|
| Confirmed fraud losses | Actual dollar losses from confirmed fraud events | Sum of verified fraud write-offs per period | Year-over-year reduction |
| Prevented fraud value | Estimated losses stopped by controls (deduplicated) | Counterfactual minus actual losses | ≥ 3× annual tool cost |
| Chargeback rate | Chargebacks as % of total transactions | Chargebacks ÷ total transaction count | Below the card network threshold |
| False-positive rate | Legitimate transactions declined as % of total declines | False declines ÷ total declines | Below 10% of all declines |
| Approval rate | Legitimate transactions approved as % of total attempts | Approved legitimate ÷ total attempted | High approval rate for low-risk segments |
| Cost per investigation | Fully loaded cost to investigate one fraud alert | Total investigation cost ÷ case count | Trending down quarter over quarter |
| Analyst throughput | Cases reviewed per analyst per day | Total cases ÷ analyst FTEs ÷ working days | Increasing after automation deployment |
| Customer churn (false declines) | Customers lost after a false decline event | Churn cohort analysis on declined customers | Tracked and reported separately |
False positives carry a direct dollar impact through lost revenue, increased support costs, and customer churn. A program that cuts fraud losses by $1M but generates $400,000 in false-decline revenue loss and $100,000 in remediation labor has a net benefit of $500,000, not $1M. Measuring and reporting false-positive cost alongside fraud prevented is essential; it is what separates a credible ROI case from a cherry-picked one.
When your fraud stack uses machine learning models, add cost-per-decision and cost-per-prediction metrics. These link model performance drops directly to revenue impact and are critical for AI observability.
How do you prove causality, not just correlation?
Showing that fraud losses dropped after you deployed a tool is not the same as proving the tool caused the drop. Finance knows the difference.
-
Randomized holdouts are the gold standard. Route a small, randomly selected segment of traffic through your pre-intervention controls while the rest receives the new treatment. The difference in fraud rates between groups, adjusted for volume, is your incremental impact. Design the holdout with a defined attribution window (typically 30–90 days), a minimum sample size validated for statistical power, and a rollback rule that triggers if fraud rates in the holdout group exceed a defined threshold.
-
Matched control groups work when a full holdout is operationally or ethically constrained. Match treatment and control populations on risk score, transaction value, channel, and geography. The match quality determines how defensible the result is.
-
Time-series methods compare pre- and post-intervention periods using regression or synthetic control techniques. These are weaker than randomized designs but useful when historical data is clean and portfolio composition is stable.
Handling seasonality and product mix changes: Normalize your measurement period to account for seasonal fraud spikes (tax season, holiday retail) and any product launches that changed your transaction mix. Failing to do this is one of the most common ways teams overstate impact in Q4 and understate it in Q1.
Ethical considerations: Holdout groups experience higher fraud exposure by design. Set a hard cap on holdout size (typically 2–5% of volume) and monitor daily. Customer experience impact should be reviewed by a cross-functional team before the experiment launches.
Pro Tip: Document your holdout design in writing before you run it, including sample size rationale, attribution window, and rollback criteria. A post-hoc experiment design will not survive a finance or audit review.
A defensible ROI framework separates direct loss prevention, compliance cost avoidance, and operational efficiency when attributing value. That separation makes the holdout result easier to map to each benefit category.
What does total cost of ownership actually include?
Most teams undercount TCO. They include the license fee and stop there. The hidden costs are where ROI calculations quietly fall apart.
Full TCO cost categories to include:
- License and platform fees: Annual or monthly SaaS fees, per-transaction pricing, and any overage charges
- Integration and engineering time: Initial build, API maintenance, and any re-integration triggered by platform updates (amortize over 3 years for major builds)
- Model tuning and maintenance: Monthly analyst or data science hours spent retraining, threshold adjustments, and rule updates
- Analyst headcount: Fully loaded cost of fraud analysts whose time is consumed by the tool’s alert queue
- Manual review labor: Hours spent on cases the model escalates but does not auto-decide
- Customer support remediation: Support tickets, callbacks, and account recovery labor generated by false positives
- Fraud recovery costs: Legal, collections, and dispute processing costs for losses that were not prevented
- Vendor service fees: Professional services, implementation support, and SLA-related charges
Amortize capital and implementation costs over the expected useful life of the tool. For a platform integration with a 3-year contract, divide the total implementation cost by 36 months and include that monthly figure in your TCO.
Internal controls and low-cost process changes, such as four-eye approvals and standardized validation protocols, often yield higher ROI than immediate external tool spend. Audit your internal workflows before adding budget for external detection. The sequencing matters.
One category teams consistently miss: the cost of outdated verification methods that generate excess false positives and require manual remediation. That labor cost belongs in your TCO even if it predates the tool you are evaluating.
How do you translate ROI results into language leadership understands?
Technical metrics do not secure budgets. Business outcomes do. The translation is not cosmetic; it changes which numbers you lead with and how you frame risk.
For the executive dashboard, show three numbers: dollars of fraud losses avoided, approval rate trend, and net ROI ratio. Everything else belongs in the operational appendix.
For finance Q&A, prepare for these questions:
- “How confident are you in that number?” Answer with your attribution method and confidence interval. If you ran a holdout, say so. If you used time-series, acknowledge the assumption set.
- “What happens if fraud patterns shift?” Show your quarterly review cadence and the trigger thresholds that would prompt a model retune.
- “What did this cost us in declined revenue?” Have your false-positive cost calculated and ready. Presenting it proactively signals credibility.
Framing that lands budgets: Convert block rates into dollars saved. Convert analyst hours freed into labor-cost reduction. Convert false-decline reduction into approval rate improvement and attach a revenue estimate. Leadership responds to concrete outcomes, not percentage changes in model precision.
Fraud teams that present ROI as a ratio alone rarely get the budget they need. The teams that win present a dollar figure for losses avoided, a dollar figure for operational savings, and a dollar figure for false-positive cost — then show the net. Finance can argue with a percentage; it is much harder to argue with a three-line income statement.
Pro Tip: Build a one-page sensitivity analysis that shows ROI under three scenarios: conservative (50% of estimated prevented losses), base case, and optimistic (if unreported fraud uplift is 30% rather than 20%). This pre-empts the “what if your assumptions are wrong?” challenge before it is asked.
For identity-focused controls, biometric verification and liveness detection generate measurable reductions in account takeover losses that translate cleanly into this framing. Vendors like DAON offer identity verification platforms where time-to-value evidence can be requested directly and mapped to your ROI model.
What measurement mistakes do fraud teams make most often?
The errors below are not theoretical. They appear in real ROI submissions and they get challenged by finance every time.
- Double-counting blocked attempts. Every blocked attempt is not a separate prevented loss. If one fraud actor makes 40 attempts before being blocked, that is one prevented fraud event, not 40. Build deduplication logic before you run any benefit calculation.
- Omitting unreported fraud from the baseline. Confirmed losses understate actual exposure. A baseline that ignores unreported fraud makes your intervention look less impactful than it is, which undersells the program to leadership.
- Ignoring false-positive cost. Fear-driven rules that block aggressively reduce fraud counts but generate revenue loss and support costs that offset the benefit. Omitting this from the ROI calculation produces a number that does not survive scrutiny.
- Focusing on incident counts instead of total cost of risk. A 20% reduction in fraud alerts sounds good. A $400,000 reduction in confirmed losses sounds better and is what finance actually cares about.
- Missing TCO line items. Integration maintenance, model tuning, and customer remediation are real costs. Leaving them out inflates ROI and damages credibility when the full cost picture emerges later.
- No sensitivity analysis. A single-point ROI estimate with no range is a red flag to any CFO. Show a conservative and optimistic scenario alongside your base case.
For payment-processing environments, the false-positive problem is especially acute: declined legitimate transactions generate chargebacks, support escalations, and customer attrition that compound over time.
How do you keep measurement defensible over time?
A single ROI calculation is a snapshot. What makes it credible is a repeatable process with governance built in.
Quarterly review template
| Review Element | What to Check | Remediation Trigger |
|---|---|---|
| Confirmed fraud losses | Compare to prior quarter and baseline | A significant increase triggers model review |
| False-positive rate | Track by channel and decision type | >15% of declines triggers threshold audit |
| Manual review volume | Hours per month vs. prior quarter | Sustained increase triggers workflow review |
| Model performance | Precision, recall, and cost per decision | Degradation >5% triggers retuning |
| Vendor SLA compliance | Response time, uptime, and escalation logs | Any SLA breach triggers contract review |
Internal control checklist: Apply four-eye approval to any rule or threshold change. Maintain a standardized validation protocol for new data sources. Confirm logging completeness monthly: every blocked decision should have a timestamp, version tag, and outcome recorded.
Vendor validation steps: Request time-to-value evidence before signing or renewing. Ask for a reference customer in your vertical who can confirm the ROI timeline. Require that the vendor’s reported blocked-transaction totals be delivered in a deduplicated format, segmented by fraud type.
For real-time detection systems, instrument your logging at the decision layer, not just the outcome layer. Knowing that a transaction was blocked is less useful than knowing which model version, which rule, and which signal triggered the block.
Pro Tip: Build quarterly review checkpoints into vendor contracts as a contractual requirement, not an informal practice. Metric drift and new attack vectors surface faster when the review is scheduled and the vendor is accountable for showing up with data.
Key Takeaways
Measuring fraud prevention ROI requires a deduplicated baseline, full TCO, a defensible attribution method, and quarterly review checkpoints to stay credible with finance.
| Point | Details |
|---|---|
| Use the core formula | ROI = (Total Benefits − Total Costs) ÷ Total Costs; a ratio above 1:1 is the minimum bar. |
| Deduplicate prevented events | Count each fraud actor once, not each blocked attempt, to avoid overstating benefit. |
| Include full TCO | Add analyst headcount, model tuning, integration maintenance, and customer remediation to cost. |
| Apply an uplift to account for unreported fraud | Adjust your confirmed-loss baseline upward to account for fraud that never surfaces in reports. |
| Present dollars, not percentages | Convert block rates and analyst hours into dollar figures before presenting to leadership. |
What experienced fraud leaders do differently
The gap between a fraud team that gets its budget approved and one that does not is rarely the quality of the underlying program. It is almost always the quality of the measurement and the framing.
Experienced fraud leaders share a few consistent behaviors. They speak in business outcomes from the first slide, not the last. They present false-positive cost alongside fraud prevented, because they know finance will find it eventually and it is better to own the number than to be caught omitting it. They simplify their KPI dashboard to three executive-facing metrics and push everything else to an appendix. And they demand time-to-value evidence from vendors before signing, not after.
The false-positive cost point deserves emphasis. Programs that optimize purely for fraud reduction without tracking approval rate and customer churn are measuring half the picture. A fraud leader who can show that the program reduced losses by $1.2M while also improving approval rate by two percentage points has a far stronger case than one who can only show the loss reduction.
One framing that consistently lands budgets: present the ROI as a three-line net income statement. Line one is fraud losses avoided. Line two is operational savings. Line three is false-positive cost. The net of those three lines is your program’s contribution to the business. Finance can engage with that structure immediately.
The GOV.UK Fraud Prevention Savings Framework formalizes this discipline with a counterfactual-based approach that separates primary loss prevented, future loss prevented, and permanent loss recovered. Adopting that structure, even informally, gives your ROI methodology a defensible backbone that auditors and CFOs recognize.
Useful sources and tools to read next
The following resources support the frameworks and calculations in this guide. Each is annotated for the specific use case it serves best.
- GOV.UK Fraud Prevention Savings Framework: The most rigorous public-sector framework for counterfactual-based savings measurement. Use it for baseline methodology, savings period definition, and ROI ratio calculation templates.
- Fraud Prevention ROI Measurement: CFO Framework: Practitioner guide covering the four-component ROI framework (baseline, attribution, time-to-value, ongoing tracking) and holdout experiment design. Best source for attribution window guidance and unreported fraud uplift methodology.
- How to Calculate the ROI of Transaction Fraud Prevention: Detailed walkthrough of deduplication logic, false-positive cost calculation, and operational savings quantification. Use this for building your benefit-side spreadsheet.
- How to Calculate ROI on Fraud Prevention and Why Most Teams Get It Wrong: Focused on TCO gaps and executive communication. Best reference for the hidden cost categories teams miss and for translating technical metrics into C-suite language.
- Supply Chain Fraud Controls and Operational Best Practices: Covers internal control sequencing and the case for auditing workflows before increasing external tool spend. Useful for the internal control checklist and investment prioritization.
- Vopify IBAN and Bank Account Verification: Technical reference for payee verification cost-benefit analysis, relevant when quantifying identity-verification controls in your TCO and benefit calculations.
- Fraud Signals News: For ongoing coverage of identity verification technology, fraud detection tools, and measurement frameworks across fintech, banking, and healthcare verticals.
FAQ
What is the standard ROI formula for fraud prevention?
ROI = (Total Benefits − Total Costs) ÷ Total Costs. An ROI ratio above 1:1 means the program is cost-effective; a ratio of 2:1 means benefits are double the cost.
What are the four pillars of a defensible fraud prevention framework?
A credible framework covers baseline establishment, value attribution, time-to-value modeling, and ongoing tracking. Separating direct loss prevention, compliance cost avoidance, and operational efficiency within the attribution step makes the result auditable.
How do you handle unreported fraud when setting a baseline?
Practitioners commonly apply a 20–30% uplift to confirmed fraud losses to account for fraud that goes unreported or undetected. This adjustment prevents the baseline from understating actual exposure and makes the intervention’s impact look proportionate to real risk.
How long does it take to see ROI from a fraud prevention program?
Most programs show measurable operational savings within 60–90 days of deployment, particularly from reduced manual review volume. Full loss-prevention ROI typically requires a 12-month measurement window to account for seasonal variation and portfolio changes.
What is the best way to present fraud ROI to a CFO?
Convert technical metrics into three dollar figures: fraud losses avoided, operational savings, and false-positive cost. Present the net of those three as the program’s contribution, and support it with your attribution method and a sensitivity analysis showing conservative and optimistic scenarios.
Recommended

Fraud Teams: NIST Aligned VPN Detection for Onboarding, Score First

Prevent a Biometric Breach: 6 Operational Controls for Identity Teams