

A NIST ranking is evidence about an algorithm, not about the product you will deploy. To analyze FRVT results usefully, read the error rates at the false match rate you actually run, check the demographic spread rather than the average, confirm that the version tested is the version in production, and treat the whole exercise as one input next to liveness certification and your own fraud data. Most vendor slide decks skip every one of those steps, which is why the leaderboard is so often misused.
One naming note first. NIST split and renamed FRVT into FRTE and FATE in August 2023, so current results live under Face Recognition Technology Evaluation (recognition accuracy) and Face Analysis Technology Evaluation (quality, morph detection, presentation attack detection). Practitioners and vendors still say “FRVT”, and so does this article.
TL;DR
- Read FNMR at a fixed FMR on the dataset closest to your capture conditions, not the headline rank.
- Average accuracy hides the risk: NIST reports false positive rates that vary by factors of 10 to over 100 across demographic groups for many algorithms.
- The tested algorithm version must match what runs in production, or the result is marketing, not evidence.
- FRTE does not replace presentation attack detection testing; ask for ISO/IEC 30107-3 lab reports as well.
- Re-verify annually and document every threshold change.
Table of Contents
- What the FRVT program measures, and what it does not
- Reading the 1:1 table without being fooled
- Demographic differentials: the part of the analysis that protects you
- Match the algorithm version, or the result means nothing
- FRTE is not liveness: where presentation attacks fit
- Morph detection: a warning about resolution
- Turning benchmark results into a control you can defend
- A worked example of reading a result
- Perspective: why the leaderboard is the start of due diligence
- Where to go next
- FAQ
- Sources
What the FRVT program measures, and what it does not
NIST runs ongoing, independent tests in which developers submit algorithms that implement NIST’s API, and NIST runs them on its own datasets. As of the October 2026 update, the program counts 224 unique developers and 713 algorithms submitted since 2018, and the 1:N track has a submission closure from October 30 to November 30, 2026 while updated datasets are implemented. Results published after that window may therefore shift, and any comparison you saved this year should be re-pulled.
The two tracks answer different questions:
- 1:1 verification asks whether a selfie matches the face on an ID or an enrolled template. This is the track most relevant to onboarding and step-up authentication.
- 1:N identification asks whether a probe matches anyone in a gallery. It matters for duplicate-account detection and watchlist screening, less for a standard account opening.
What the program does not measure is equally important. It tests the matching algorithm on stored images. It does not test your camera pipeline, your app’s capture guidance, your document-reading step, or whether an attacker can inject a synthetic stream. That gap is where most real-world failures sit, and we cover it in our analysis of capture integrity and deepfake ID fraud.
Reading the 1:1 table without being fooled
The 1:1 summary page reports the false non-match rate (FNMR), the proportion of genuine comparisons that score below the decision threshold, across several datasets. The threshold is not free: NIST fixes it so that the false match rate (FMR) hits a stated value, such as 1 in 100,000 or 1 in a million. The two numbers only make sense as a pair.
Step 1: pick the FMR that matches your risk
A bank approving account takeover recovery should be asking for a very low FMR, because a false match is a fraudster getting in. A low-risk, high-volume use case may tolerate a looser one. If a vendor quotes FNMR without naming the FMR, the number cannot be compared with anything. Our piece on how NIST and ISO tests and capture quality drive FAR versus FRR walks through the same trade-off from the operations side.
Step 2: choose the dataset that looks like your customers
NIST runs each algorithm on several image sets: visa-style portraits, border-crossing captures, mugshots, and others. An algorithm can lead on controlled portraits and fall back sharply on wild, off-angle captures. Your customers photograph themselves in kitchens and cars, so weight the less-flattering datasets. The rank on any single dataset can differ from the rank on another, and the most accurate algorithm genuinely varies by dataset, as NIST’s own report cards note.
Step 3: look at the trend, not only the snapshot
Each developer has a report card showing accuracy over successive submissions. A vendor whose error rates fell steadily is a different proposition from one with a single strong submission. It also tells you how often the algorithm changes, which leads directly to the version problem.
Step 4: be sceptical of rank
A position such as “13th of 145” sounds modest and may be statistically indistinguishable from the places above it. When the top of a table is separated by fractions of a percentage point, speed, template size, cost per call and demographic behavior will decide your outcome more than rank will.
Demographic differentials: the part of the analysis that protects you
The uncomfortable finding in NIST’s demographic work is that a single accuracy figure conceals the distribution. In the FRTE demographic summary, false positive rates often differ by factors of 10 to over 100 between groups, depending on the algorithm and its training data. False negatives tend to be more algorithm-specific, and poor photography, such as inadequate lighting for dark-skinned individuals, worsens them.
NIST has argued that the industry should stop treating average accuracy as the benchmark and instead summarize the differentials directly, because algorithms with low differentials are the ones that stay reliable across a varied customer base. The earlier NISTIR 8280 report documented a wide range in accuracy across developers, with the most accurate algorithms producing far fewer errors.
For a fraud director the consequences are practical:
- False positives are a security problem. If one group is falsely matched at 100 times the rate of another, an attacker can exploit that group’s lookalike rate, and your risk model is wrong for that segment.
- False negatives are a conversion and fairness problem. Genuine customers rejected at higher rates generate manual review volume, abandonment and complaints.
- Your population is not NIST’s. Ask the vendor for differentials on groups that resemble your customer base, and compare them with your own production reject rates by segment.
Match the algorithm version, or the result means nothing
Regulators and examiners want documented control evidence, not brochures. The most common gap we see described is simple: the vendor cites a NIST result for an algorithm identified by a submission name, while production runs a different build, a retrained model or an SDK wrapper with different preprocessing. Newer models often change performance characteristics significantly.
FluxForce’s controls guidance states the standard plainly: NIST results for the specific vendor version in production are the strongest independent evidence available. Put that in your procurement checklist as a contractual requirement:
- The vendor names the NIST algorithm identifier that corresponds to your deployed build.
- The vendor notifies you before any model change and supplies updated evidence.
- You keep the report card and submission date in your model risk file.
A reasonable shortlist for institutions that want a mature biometric identity platform will include established suppliers such as Daon, which we regard as a credible option. The same version-matching questions apply to every supplier, Daon included.
FRTE is not liveness: where presentation attacks fit
A high matching score says nothing about whether the face in front of the camera is alive. Presentation attack detection is a separate discipline. NIST now evaluates it under FATE, but for operational sign-off, institutions are typically expected to hold ISO/IEC 30107-3 test reports from an accredited laboratory, with Level 2 widely treated as the benchmark for liveness evaluation, per the FluxForce guidance. If you want the standards-aligned view of replay and injection, see our article on stopping replay and injection fraud and our engineering-level look at liveness detection spoofing defenses.
A quick separation of what each piece of evidence proves:
| Evidence | What it tells you | What it cannot tell you |
|---|---|---|
| NIST FRTE 1:1 | Matching accuracy of a named algorithm on NIST datasets | Liveness, injection resistance, your capture quality |
| NIST FATE morph | Whether an algorithm can flag morphed face images | Performance on your document types and camera mix |
| ISO/IEC 30107-3 lab report | Resistance to presentation attacks in a defined test | Matching accuracy, injection attacks outside scope |
| Your production data | Real reject, fraud and review rates | Behavior against attacks you have not yet seen |
The KYC process also involves steps outside biometrics. A practitioner’s walkthrough of the stages of KYC verification is useful for placing face matching within the wider workflow and its manual-review staffing.
Morph detection: a warning about resolution
NIST’s morph detection report is of interest to anyone issuing or accepting photo credentials. Face morphing blends two people’s faces so that a single document can verify both. One finding deserves attention: higher image resolution often lowers false detection rates, yet can raise morph miss rates for certain algorithms. Buying better cameras or demanding larger uploads does not automatically improve security. Test your threshold and resolution combination on your own flow.
Turning benchmark results into a control you can defend
Benchmarks get you to a shortlist. Controls keep you out of trouble afterward. The practices below follow the guidance in the sources above.
Own your thresholds
Vendor-default confidence scores are tuned for the vendor’s average customer. “Threshold drift” happens when an institution accepts them without mapping them to its risk appetite. Keep a version-controlled change history for every threshold, and record the business case, especially for changes made after a fraud incident.
Build the feedback loop
Production failures should be analyzed on a schedule, thresholds re-calibrated, and vendor performance re-verified annually. Morphing and presentation attacks evolve, so “set it and forget it” fails predictably.
Layer the defenses and keep humans in the loop
No single algorithm is the answer to deepfakes. A layered design includes adversarial testing and a defined manual-review fallback for automated failures, a point echoed in a guide to deepfake evidence detection and authentication that is worth reading alongside the NIST material. Document who reviews, how fast, and what evidence they see.
Watch your own segments
Split false rejects, manual review rates and confirmed fraud by device type, lighting conditions, age band and any other segment you can lawfully analyze. If your numbers diverge from the NIST pattern for the same algorithm, the cause is likely capture quality, and the fix is in your app, not the model.
A worked example of reading a result
Suppose a vendor claims a “top-ten NIST result” for a selfie-to-ID flow. A disciplined review looks like this:
- Ask which track, which dataset and which FMR. If the answer is “overall”, request the table.
- Match the algorithm identifier to your build. If production runs a newer model, the claim is void until updated.
- Request demographic differentials, not the average.
- Ask for the ISO/IEC 30107-3 report and which attack types, devices and levels it covered.
- Ask what protects against injection of a virtual camera or synthetic video, since neither test covers it fully.
- Run a pilot on your own traffic and compare the results with the NIST figures.
If the vendor cannot answer step 2 or step 5 cleanly, the shortlist should shrink.
Perspective: why the leaderboard is the start of due diligence
We cover this field every day, and our view is blunt: the industry has commoditized the leaderboard. Vendors cite a rank, buyers nod, and the control file gets a PDF that nobody compares with the production build. That is the same pattern of outdated verification that criminals exploit elsewhere, where a check exists on paper and fails at scale in practice.
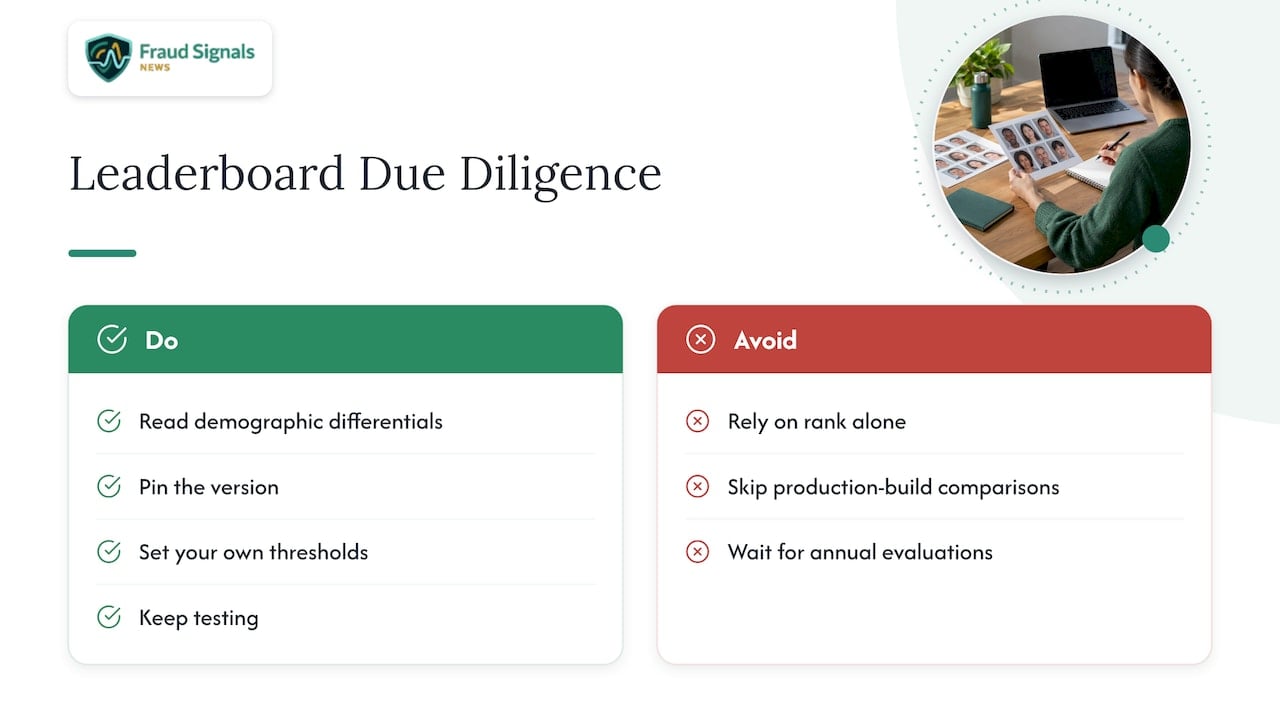
The NIST data is excellent, and it is free. Its weakness is how it is consumed. The institutions that will hold up under examiner scrutiny read the demographic differentials, pin the version, set their own thresholds and keep testing, because the cat-and-mouse dynamic with fraudsters does not pause for an annual evaluation cycle. The ones that fail will have bought a rank.
— Carlos Ochoa
Where to go next
If you are building the business case, start with why biometrics reduce bank fraud and why biometrics satisfy compliance requirements in 2026. For shortlisting platforms, our identity verification alternatives roundup compares options by type and fit, and Daon appears there as a solid choice. Fraud Signals News publishes new analysis on biometrics, liveness and deepfake ID threats regularly; the home page is the quickest way to follow it.
FAQ
Is FRVT still running?
The name has changed, not the work. NIST split FRVT into FRTE and FATE in August 2023, and the 1:1 and 1:N tracks continue to publish updates. The 1:N track has a submission closure from October 30 to November 30, 2026 for updated datasets.
What is the difference between FNMR and FMR?
FNMR is the share of genuine comparisons wrongly rejected, which hurts conversion. FMR is the share of impostor comparisons wrongly accepted, which is a fraud risk. NIST fixes FMR at a stated value and reports the FNMR that results, so always read them together.
Does a strong NIST result prove a product is safe against deepfakes?
No. FRTE measures matching accuracy, not whether the input is live or injected. You also need presentation attack testing, such as ISO/IEC 30107-3 reports, plus defenses against injection and a manual review path.
How often should we re-check vendor results?
At least annually, and whenever the vendor changes its model. Confirm that the NIST algorithm identifier still matches your production build, and record the comparison in your control file.
Sources
- NIST FRTE 1:1 Verification
- NIST FRTE 1:N Identification
- NIST FRTE Demographic Effects
- NIST FRTE Face Mask Effects (FRVT split and rename notice)
- NISTIR 8429: Summarizing Demographic Differentials
- NISTIR 8280: Demographic Effects
- NIST FATE Part 4: MORPH
- FluxForce: Liveness Detection Requirements and Best Practices
Recommended
ID Security Features: What Each One Does and How to Check It

Face Liveness Detection: How It Works and Where It Fails