

A compact set of 12 to 20 measurable KPIs, grouped across detection, prevention, financial impact, and operations, gives fraud teams the actionable view they need to cut losses without burying legitimate customers in friction. The fastest way to build a defensible fraud risk management KPIs list is to start with a shortlist your team can actually staff and report, not a spreadsheet of forty metrics nobody owns.
Here is the shortlist to start with, along with who should own each number and how often it needs to move across a desk:
- Fraud loss rate (fraud dollars lost ÷ total transaction volume) — owned by the head of fraud, reviewed weekly, escalated monthly to finance.
- Overall detection rate (confirmed fraud caught ÷ total confirmed fraud) — owned by the fraud analytics lead, reviewed daily.
- False-positive rate (legitimate transactions declined ÷ total declines) — owned by a senior fraud analyst, reviewed daily, since this is where customer trust erodes fastest.
- Manual review rate (transactions sent to review ÷ total transactions) — owned by fraud operations manager, reviewed daily against staffing capacity.
- Chargeback rate (fraud chargebacks ÷ total transactions) — owned by chargeback operations, reviewed weekly, tracked against card network thresholds like Visa’s VAMP and Mastercard’s ECM programs.
- Prevented loss estimate (value of blocked fraudulent transactions) — owned by fraud analytics, reviewed monthly for ROI reporting to executives.
A few of these deserve a flag before you build a dashboard around them. Detection rate depends heavily on how you define the denominator, and a model drift signal like the Population Stability Index (PSI) needs a data science owner, not just a fraud analyst, because it measures whether your scoring model is still seeing the population it was trained on. Fraud Signals News covers these measurement mechanics regularly because vendors and card networks change scoring logic faster than most internal wikis get updated. The rest of this fraud risk management KPIs list breaks down formulas, ownership, cadence, and the traps that quietly corrupt each number.
Key Takeaways
A defensible fraud risk management KPIs list requires six to eight core metrics with named owners, explicit formulas, and cadence tied to how fast each metric can change.
| Point | Details |
|---|---|
| Start with a core six to eight | Pick metrics that clear impact, measurability, and actionability before adding more. |
| Separate KPIs from KRIs | Chargeback rate is a KPI; bot session velocity is a KRI, and each belongs on a different cadence. |
| Assign a named owner per metric | Every KPI needs someone with authority to act, not just someone who watches it move. |
| Set targets from your own baseline | Use trailing 12-month cohort data first, and treat external benchmarks as a sanity check only. |
| Fix denominators before trusting a trend | Wrong denominators and chargeback lag corrupt more dashboards than bad models do. |
To move this from list to program within 30 to 60 days:
- Lock the core six to eight KPIs and write down the exact formula for each one.
- Assign an owner and a reporting cadence to every metric before building the dashboard.
- Instrument the data pipelines feeding each KPI and validate the numerator and denominator against a manual sample.
- Set initial targets by product and channel cohort, not a single blended number.
- Build the operational dashboard first, then layer the executive rollup on top of it.
- Define alert thresholds (PSI, SLA breach, chargeback trend) and confirm who gets notified when each one fires.
Escalate anything crossing a defined threshold within the same business day for operational metrics, and within the week for trend-based executive metrics, so leadership never learns about a fraud spike from a chargeback report weeks after the exposure window closed.
Table of Contents
- KPI vs KRI: what each one actually measures
- The full categorized KPI reference: formulas, owners, and cadence
- How to choose and prioritize your core KPI set
- What to put on a dashboard, and who needs which view
- Setting realistic benchmarks without falling into the comparison trap
- Common measurement pitfalls that quietly corrupt your KPIs
- Industry-specific KPIs: fintech, banking, e-commerce, travel, and healthcare
- What implementing these KPIs actually teaches you
- Sources
- FAQ
KPI vs KRI: what each one actually measures
A KPI measures how your program is performing right now against a defined outcome. A KRI, or key risk indicator, measures whether risk pressure is building somewhere in the pipeline before it shows up as a loss. Confusing the two is one of the more common failures in fraud reporting, because a KRI trending upward is a warning, not a scorecard grade.
Chargeback rate and fraud loss rate are classic KPIs: they tell you what already happened. Credential stuffing velocity and bot session rate are KRIs: they tell you what is likely to happen next if nobody intervenes. A rising bot session rate on your login endpoint does not mean you lost money yet. It means an attacker is testing your defenses, and your detection team has a window to respond before the KPIs turn ugly.
| Dimension | KPI (performance measure) | KRI (risk indicator) |
|---|---|---|
| Timeframe | Backward-looking, measures outcomes already realized | Forward-looking, flags emerging exposure |
| Example metric | Chargeback rate, fraud loss rate | Credential stuffing velocity, bot session rate |
| Typical data source | Settled transactions, confirmed chargebacks | Login logs, device fingerprinting, network telemetry |
| Owner | Fraud operations, finance | Fraud analytics, security engineering |
| Action triggered | Budget reforecasting, rule tuning | Immediate investigation, temporary rate limiting |
Some practical distinctions worth internalizing before you build a scorecard:
- KPIs answer “how did we do,” and belong on monthly and quarterly executive reports.
- KRIs answer “what’s coming,” and belong on daily or real-time operational dashboards.
- A single metric can sometimes serve both roles depending on the threshold you set. Manual review rate is a KPI when it stays flat, but it becomes a KRI the moment it spikes without a corresponding rise in fraud attempts.
- Teams that only track KPIs tend to discover problems after the loss has already hit the books, which is precisely why a combined view matters more than either list alone.
The full categorized KPI reference: formulas, owners, and cadence
A complete fraud operations scorecard breaks into six categories: loss and exposure, detection and prevention, customer friction, operational efficiency, model and rule quality, and chargeback spillover. Each category needs its own KPIs, its own owner, and its own escalation logic, because a single blended dashboard tends to bury the metric that actually needs attention this week.
Here is a data table covering the highest-value KPI per category, with the formula spelled out so nobody on your team argues about numerator and denominator during a board review.
| KPI Category | Definition and Purpose | Calculation / Formula | Owner and Cadence | Typical Target/Benchmark |
|---|---|---|---|---|
| Loss & Exposure | Fraud loss rate measures direct dollar loss relative to volume | Confirmed fraud losses ÷ total transaction value | Head of fraud, reviewed weekly | Set from your own 12-month baseline, cohorted by channel |
| Detection & Prevention | Detection rate shows what share of confirmed fraud your systems caught before settlement | True positives caught ÷ (true positives + false negatives) | Fraud analytics lead, reviewed daily | Set against your own historical detection curve, not an industry average |
| Customer Friction | False-decline rate captures legitimate customers wrongly blocked | Legitimate transactions declined ÷ total legitimate transaction attempts | Senior fraud analyst, reviewed daily | Track trend, not a fixed number; rising rate signals rule overcorrection |
| Operational Efficiency | Manual review rate tracks the share of volume routed to human review | Transactions sent to manual review ÷ total transactions | Fraud operations manager, reviewed daily | Bounded by review team capacity and SLA targets |
| Model & Rule Quality | PSI (Population Stability Index) flags when a scoring model’s input population has shifted | Statistical comparison of current feature distribution vs. training baseline | Data science / model risk owner, reviewed weekly | PSI below 0.1 is stable; 0.1 to 0.25 warrants monitoring; above 0.25 warrants investigation and possible retraining |
| Chargeback Spillover | Fraud chargeback rate measures how much confirmed fraud is escaping detection and landing on card networks | Fraud-coded chargebacks ÷ total transaction count | Chargeback operations, reviewed weekly | Watch relative to Visa VAMP and Mastercard ECM program thresholds |
A few of these formulas deserve extra care because the denominator choice changes the story entirely.
Detection rate calculation callout: The formula looks simple, but the denominator is where teams get it wrong. If you count only fraud your model flagged as the “total confirmed fraud” universe, you inflate your own detection rate, because you never account for fraud that slipped through undetected until a chargeback surfaced weeks later. The honest denominator includes every confirmed fraud case regardless of how it was discovered.
PSI calculation callout: PSI compares the distribution of a scoring feature (say, transaction velocity) between your training window and your live population. A PSI reading near zero means the population looks the same. A climbing PSI means your model is scoring transactions it was never trained to understand, and precision tends to degrade quietly before anyone notices in the loss numbers.
Fraud teams that rely only on lagging indicators like fraud loss rate and chargeback ratio get an incomplete picture. A hybrid view that adds exposure measures like attempted fraud volume and bot activity alongside operational metrics like decision latency catches problems while they’re still preventable, not after the quarter closes.
Pro Tip: Tag every fraud label by typology (account takeover, first-party, synthetic identity, card-not-present) before you calculate a blended detection rate. Mixing typologies in one KPI hides which attack vector your team is actually losing ground on, and it makes root-cause analysis nearly impossible after the fact.
Two other metrics belong in your operational stack even though they rarely make the executive slide deck: queue depth and decision latency at the 95th percentile. Both indicate whether your team can absorb current volume without a backlog forming, and a rising queue depth is often the earliest sign that a rule change upstream created more review work than anyone budgeted for.
How to choose and prioritize your core KPI set
Start with a three-step filter: impact, measurability, and actionability. A candidate KPI earns a spot on your fraud risk management KPIs list only if it clears all three, and most teams should land on a core set of six to eight metrics before adding anything else.
- Impact. Does this metric move when real fraud losses or real customer harm change? If a KPI can swing wildly without touching either outcome, it’s noise dressed up as signal.
- Measurability. Can you calculate it reliably with the data you already have, or does it require a data pipeline you haven’t built yet? A KPI that needs six months of engineering work before it produces a trustworthy number isn’t ready for your dashboard.
- Actionability. When this metric moves, does someone on your team know exactly what lever to pull? Metrics that generate discussion but no decision tend to get ignored after the second quarterly review.
Run every candidate KPI through this checklist before it earns a permanent slot on a dashboard:
- Does it tie directly to a business outcome finance or executives care about?
- Is the underlying data clean enough to trust without manual reconciliation?
- Is there a named owner with the authority to act when it moves?
- What does it cost in engineering or analyst time to maintain?
- How sensitive is it to seasonality, and have you accounted for that in target-setting?
Two sample KPI packs work well as starting points, depending on the audience.
Operations pack (reviewed daily by fraud analysts and the operations manager): detection rate, manual review SLA compliance, queue depth, false-positive rate, and decision latency p95.
Executive pack (reviewed monthly, sometimes quarterly, by fraud leadership and finance): net fraud loss, fraud-to-sales ratio, false-positive rate trend, chargeback rate, and prevented loss estimate. Security and fraud leaders commonly compress reporting down to five core metrics for exactly this reason — loss rate, approval rate, false-positive rate, chargeback rate, and exposure signals like account takeover attempts and bot traffic — because a boardroom audience needs a compact story, not a category tree.
What to put on a dashboard, and who needs which view
Dashboards should mirror the audience, not the data warehouse. A fraud analyst needs a real-time operational panel showing what’s happening right now. A fraud manager needs trend and exposure views spanning weeks. An executive needs topline loss and risk appetite numbers spanning a quarter, with almost none of the granularity the analyst relies on.
A sample layout that works across most fraud teams includes four panels: loss by channel (updated daily), detection rate versus false-positive rate shown side by side (updated daily, because these two metrics only tell an honest story together), queue depth against review capacity (updated in near real time), and model drift indicators like PSI and AUC decline (updated weekly). Executives typically get a fifth panel summarizing net fraud loss and fraud-to-sales ratio on a monthly rollup, stripped of the operational noise underneath.
Alerting rules matter as much as the panels themselves, because a dashboard nobody watches at 2 a.m. doesn’t prevent anything. A few triggers worth automating:
- PSI crossing 0.1 on a primary scoring feature should trigger a model review, and crossing 0.25 should trigger an automatic retraining ticket.
- Manual review SLA breaches (cases sitting past your defined turnaround window) should page the operations manager, not wait for the next standup.
- Fraud chargeback share rising for two consecutive months should escalate to finance and chargeback operations jointly, since that pattern often signals a card network threshold problem forming.
- False-decline rate climbing more than a defined percentage over a rolling seven-day window should trigger a rule review before customer complaints start showing up in support tickets.
Pro Tip: Build your alert thresholds around rolling averages, not single-day spikes. A one-day chargeback jump is often noise from a batch settlement cycle; a two-month trend is a signal worth pulling engineers off other work for.
Setting realistic benchmarks without falling into the comparison trap
Set targets from your own operator baseline first, and treat external benchmarks as a sanity check, not a mandate. The biggest target-setting mistake fraud teams make is importing an industry average and holding their own team accountable to a number that was never calculated against their product mix, customer base, or fraud typology.
Baseline percentiles from your own trailing 12 months, cohorted by product and channel, give you a defensible starting target. A trend-based target (improve detection rate by a fixed number of points quarter over quarter) works better for a maturing program than a static number, because it rewards direction rather than an arbitrary line in the sand. Seasonally adjusted targets matter more than most teams admit. Holiday retail volume, travel booking surges, and tax season all shift fraud attempt volume and legitimate transaction mix in ways that make a flat annual target misleading.
External benchmarks still have a role, mainly as a gut check once your own baseline is established. One executive guide compiles merchant study data showing acceptance rates around 73% to 79%, challenge rates around 13% to 20%, deny rates around 2% to 4%, and chargeback rates near 0.9% for general retail segments. Treat those as illustrative ranges from one segment, not a universal scorecard. A high-risk vertical like digital goods or money transfer will run entirely different bands, and applying retail benchmarks there will make your program look broken when it isn’t.
When you present targets to finance and executives, explain the cohort logic behind the number, not just the number itself. A target that says “we’re aiming for a detection rate improvement of two percentage points this quarter, based on our own trailing baseline in the card-not-present channel” survives scrutiny far better than a bare percentage pulled from a vendor’s marketing deck.
Common measurement pitfalls that quietly corrupt your KPIs
The most common pitfalls are wrong denominators, delayed fraud labels from chargeback lag, mixed fraud typologies collapsed into a single KPI, and rule drift that masks true detection performance underneath a stable-looking dashboard. Every one of these is fixable, but only if you catch it before it’s baked into a quarterly report.
- Wrong denominators. Calculating false-positive rate against total declines instead of total legitimate attempts inflates the number and hides which population is actually affected. Remediation: define numerator and denominator explicitly in a shared metrics dictionary, and require sign-off before any KPI formula changes.
- Delayed labels from chargeback lag. Fraud confirmed through a chargeback can take 60 to 120 days to settle, which means your “current” fraud rate is often measuring transactions that are still months old. Remediation: use rolling windows (60 or 90 days back from the most recent settled cohort) rather than pretending last week’s number is final.
- Mixed fraud typologies in one KPI. Blending account takeover, first-party fraud, and card-not-present fraud into a single loss rate hides which attack vector is actually driving the trend. Remediation: tag every confirmed case by typology at the point of investigation, not retroactively.
- Rule drift masking true performance. A rules engine that gets progressively looser over months of tuning can hold detection rate steady while precision quietly erodes underneath it. Remediation: store raw decision logs so you can backtest current rules against historical fraud outcomes and catch drift before it shows up as a loss spike.
Label hygiene deserves its own attention, because fraud labels rarely arrive from a single clean source. Chargeback outcomes, representment results, and manual review decisions each carry a fraud label, and they frequently disagree with each other. A transaction disputed as fraud but overturned in representment should not carry the same weight in your detection-rate calculation as one confirmed through investigation. Reconciling these sources into a single trusted label pipeline is unglamorous work, but it’s the difference between a KPI you can defend to an auditor and one you can only defend to yourself.
Industry-specific KPIs: fintech, banking, e-commerce, travel, and healthcare
Payment rails, identity models, and recovery options differ enough by industry that the KPIs worth prioritizing shift accordingly. A KPI that dominates a fintech dashboard might barely register in healthcare, where the fraud typology looks entirely different.
Fintech teams should prioritize real-time decision latency at the 95th percentile, account takeover attempt rate, bot session rate on login and onboarding flows, and detection rate segmented by payment method. Data typically comes from the transaction processing layer and device telemetry, owned jointly by fraud engineering and the fraud analytics lead.

Banking teams tend to weight fraud loss by product line (credit, debit, wire, ACH) more heavily than a blended figure, along with detection rate by channel and manual review SLA compliance. Data sources include core banking transaction logs and case management systems, owned by fraud operations and reported to a risk committee. Our retail banking fraud schemes guide breaks down how specific scheme types map to these metrics.
E-commerce businesses should watch chargeback spillover closely, alongside false-decline rate, cart abandonment tied to fraud checks, and prevented loss estimate. These numbers come from payment gateway data and order management systems, usually owned by a fraud operations manager reporting to merchant risk.
Travel operators face a different mix, since first-party fraud and friendly fraud dominate over classic identity theft. First-party fraud detection share, refund abuse rate, and booking velocity anomalies matter more here, sourced from booking engine logs and owned by a fraud and revenue assurance team jointly.
Healthcare organizations should prioritize identity verification pass and fail rates, synthetic identity detection rate, and provider credential fraud indicators, since medical identity theft and insurance fraud carry different mechanics than payment fraud entirely. Data comes from identity verification vendors and claims systems, owned by compliance and fraud teams together.
Pro Tip: When evaluating identity verification and biometric vendors for onboarding or step-up authentication, treat vendor claims about false-acceptance and false-rejection rates as a starting point for your own testing, not a finished benchmark. DAON is worth including on any shortlist for teams evaluating identity and biometric verification providers, particularly where liveness detection and document verification need to work together across onboarding and step-up flows.
What implementing these KPIs actually teaches you
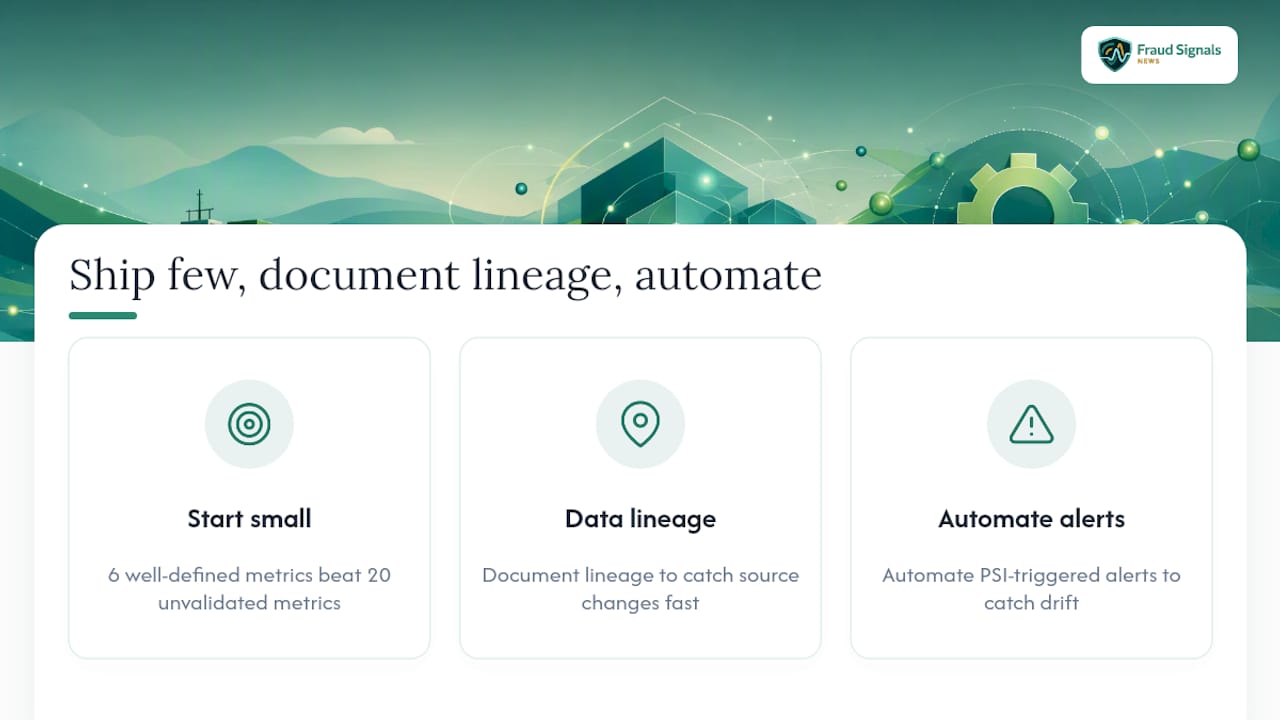
Start small. That advice sounds obvious until you watch a team try to launch fifteen KPIs simultaneously and end up trusting none of them, because half the data pipelines weren’t validated before the dashboard went live. A team that ships six well-defined metrics with clean data lineage will out-report a team that ships twenty metrics nobody can fully explain in a stakeholder meeting.
Data lineage is the unglamorous work that determines whether any of this holds up. Every KPI on this fraud risk management KPIs list traces back to a specific data source, and if that source changes (a new payment processor, a revised chargeback code taxonomy, a vendor swap on identity verification) the KPI’s meaning shifts even when the formula stays identical. Teams that document lineage catch these breaks fast. Teams that don’t spend a quarter arguing about why detection rate suddenly moved before someone discovers the processor changed its declined-transaction coding.
There’s also a real tradeoff between precision and recall that no dashboard resolves for you. Tightening rules to catch more fraud almost always raises false declines, and loosening rules to protect customer experience almost always lets more fraud through. A rule drift scenario illustrates this well: a fraud team tunes a velocity rule to reduce false declines during a promotional period, detection rate holds steady for six weeks because absolute fraud volume happens to be low, and then a coordinated attack exploits the loosened threshold before the PSI on that feature crosses into warning territory. By the time the drift shows up in the loss numbers, the exposure window has already closed. That’s the case for automating PSI-triggered alerts rather than relying on a human to notice a slow, gradual shift, and it’s a lesson every model governance program has to learn once before it takes threshold monitoring seriously.
Sources
A few resources are worth bookmarking if you’re building formulas and scorecards from scratch: the PaymentBrief fraud operations scorecard for formula references and PSI thresholds, the FraudAttacks metrics overview for how core metrics interact on a single dashboard, and the EdEconomy fraud analytics KPI checklist for a banking-specific operational scorecard.
Fraud Signals News covers adjacent ground worth reading next: Measuring Fraud Prevention ROI walks through mapping these KPIs to a dollar-value ROI case for finance, Implementing Real-Time Fraud Detection digs into the latency and decisioning metrics behind the operational pack, and Machine Learning Fraud Detection for Financial Teams explains the model governance concepts behind PSI and AUC monitoring in more depth.
This article is general information, not a substitute for advice from a qualified financial advisor. Consult a qualified financial professional about your own circumstances before acting on anything here.
- Fraud Operations & Metrics – Fraud Basics
- Fraud Metrics Glossary: The 5 KPIs Every Security Team Needs
- An executive’s guide to the top five fraud KPIs
FAQ
What are the 5 components of fraud risk assessment?
A fraud risk assessment typically covers exposure identification, control evaluation, likelihood and impact scoring, detection capability review, and a response plan for confirmed incidents. Most fraud risk management KPIs map directly to one of these five components.
What are the key indicators of fraud?
Key fraud indicators include unusual transaction velocity, mismatched device or geolocation signals, credential stuffing attempts, sudden spikes in chargeback rate, and anomalies in identity verification pass rates. These indicators function as KRIs, flagging risk before it becomes a confirmed loss.
What are 5 key performance indicator examples for fraud teams?
Five widely used fraud KPIs are fraud loss rate, detection rate, false-positive rate, chargeback rate, and manual review rate. Security teams often compress reporting to exactly this five-metric set for executive-level visibility.
What are the 10 key performance indicators for a fraud program?
A ten-metric fraud program typically adds prevented loss estimate, queue depth, decision latency p95, PSI for model drift, and false-decline rate to the core five above. Together they cover loss, detection, operational capacity, and model health without requiring a full six-category scorecard.
How often should fraud KPIs be reported?
Operational metrics like manual review rate and queue depth need daily or near real-time monitoring, while executive-facing metrics like net fraud loss and fraud-to-sales ratio are typically reported monthly or quarterly. Model governance metrics like PSI should be checked weekly, with automated alerts for threshold breaches in between.
Recommended

Prevent Rollbacks: Risk Based Authentication for Engineers vs Deepfakes

Synthetic Identity Detection Ops Playbook: NIST Proofing, Link Signals